Data Interpretation Question for IBPS Clerk
Data Interpretation Question for IBPS Clerk 2016 Exam
Study the following bar graph carefully and answer the questions that follow.
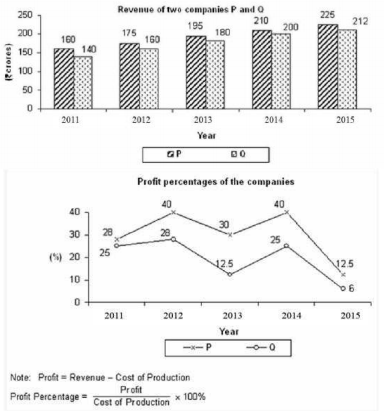
1. What is the profit obtained by the two companies P and Q together in 2015? (IBPS Clerk Pre 2016)
(a) ₹ 33 cr
(b) ₹ 37 cr
(c) ₹ 41 cr
(d) ₹ 45 cr
(e) None of these
2. In 2012, what was the ratio of profit of the company P to the profit of the company Q? (IBPS Clerk Pre 2016)
(a) 10 : 7
(b) 13 : 10
(c) 16 : 13
(d) 19 : 16
(e) None of these
3. What is the approximate percentage increase in the total profit of companies P and Q together from 2012 to 2014? (IBPS Clerk Pre 2016)
(a) 8.45%
(b) 13.35%
(c) 17.65%
(d) 20.25%
(e) 24.15%
4. In which of the given years was the total profit of both the companies together the highest? (IBPS Clerk Pre 2016)
(a) 2011
(b) 2012
(c) 2013
(d) 2014
(e) 2015
5. In how many of the given years was the profit of the company P more than the profit of the company Q by at least Rs. 15 crore? (IBPS Clerk Pre 2016)
(a) 1
(b) 2
(c) 3
(d) 4
(e) 5
Study the following bar graph carefully and answer the questions that follow.
Number of units of three different products P1, P2 and P3 produced (units in hundreds) at four different locations (L1, L2= L3, and L4) of a factory the graph. (IBPS Clerk Main 2016)
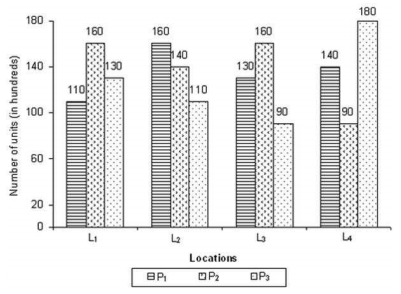
6. What is the total number of units of P2 produced (in hundreds) in the four locations together?
(a) 540
(b) 550
(c) 510
(d) 530
(e) None of these
7. What is the average number of units (in hundreds) of P, produced per location?
(a) 135
(b) 155
(c) 165
(d) 175
(e) None of these
8. In which location is the maximum number of units produced?
(a) L2
(b) L1
(c) L4 and L2
(d) L3 and L1
(e) None of these
9. By what approximate percent is the number of units of P1 produced more than the number of units of P3 produced in the four locations together?
(a) 10.9%
(b) 12.4%
(c) 16.5%
(d) 18.7%
(e) 5.9%
10. If the production cost of each of product P2 is ₹ 430, then what is the total production cost of P2?
(a) ₹ 2,26,200
(b) ₹ 2,36.500
(c) ₹ 2,46,800
(d) ₹ 2.56.400
(e) None of these
Study the following pie-chart and answer the questions given below (IBPS Clerk Main 2016)
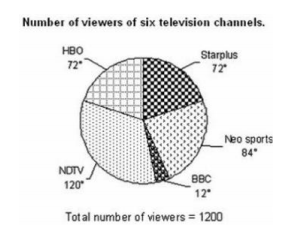
11. HBO and star plus have _______ viewers
(a) 160
(b) 340
(c) 320
(d) 480
(e) None of these
12. Which of the following represents the the ratio of the number of viewers of BBC to the number of viewers of Neo sports?
(a) 1:7
(b) 2:5
(c) 3:4
(d) 4:7
(e) None of these
13. The number of viewers of star plus forms what percentage of number of viewers of NDTV?
(a) 80%
(b) 50%
(c) 70%
(d) 60%
(e) None of these
14. Total number of viewers HBO and Neo sports have?
(a) 480
(b) 520
(c) 620
(d) 560
(e) None of these
15. The total number of viewers of NDTV and BBC forms what % of total number of viewers?
(a) 43.33%
(b) 36.66%
(c) 33.33%
(d) 26.66%
(e) None of these
Data Interpretation Question for IBPS Clerk 2016 Answers
1. (b)
2. (a)
3. (c)
4. (d)
5. (c)
6. (b)
7. (a)
8. (c)
9. (e)
10. (e)
11. (d)
12. (a)
The ratio of number of viewers of BBC to the number of viewers of Neo sports
= 12° : 84° = 1 : 7
13. (d)
The percentage of number of viewers of starplus w.r.t. the number of viewers of NDTV \(= \frac { 72 ^ { \circ } } { 120 ^ { \circ } } \times 100 = 60 \%\)
14. (b)
15. (b)
Data Interpretation Question for IBPS Clerk 2015 Exam
Study the following table carefully and answer the questions given below.
Number of Students and percentage of female students in six departments in seven colleges (IBPS CWE Clerk 2015)
|
Dept & College |
CSE
|
EC | EEE | CE | ME | MME | ||||||
| N | P | N | P | N | P | N | P | N | P | N | P | |
| P | 180 | 45 | 120 | 40 | 60 | 35 | 60 | 40 | 120 | 50 | 60 | 35 |
| Q | 120 | 35 | 180 | 35 | 150 | 40 | 60 | 45 | 180 | 35 | 160 | 25 |
| R | 60 | 40 | 150 | 50 | 120 | 45 | 180 | 40 | 150 | 40 | 60 | 30 |
| S | 90 | 50 | 60 | 45 | 90 | 50 | 120 | 35 | 60 | 50 | 120 | 40 |
| T | 180 | 35 | 120 | 35 | 60 | 35 | 90 | 40 | 90 | 40 | 180 | 35 |
| U | 60 | 40 | 90 | 40 | 150 | 40 | 60 | 35 | 180 | 35 | 150 | 50 |
| V | 180 | 35 | 60 | 45 | 180 | 35 | 180 | 50 | 120 | 50 | 120 | 35 |
N : Number of students
P : Percentage of female students
1. What is the total number of female students studying in the college R in the given six departments together?
(a) 293
(b) 303
(c) 313
(d) 323
(e) None of these
2. What is the ratio of total number of male students of the college Q in the departments CSE and EC to the total number of female students in the departments EEE and CE of the college U?
(a) 55 : 19
(b) 60 : 23
(c) 65 : 27
(d) 70 : 31
(e) None of these
3. What is the total number of male students of the colleges P, Q and R in CSE department and the total number of male students of the colleges T, U, and V in ME departments?
(a) 444
(b) 464
(c) 484
(d) 504
(e) None of these
4. What approximate percentage of students in CSE of all the colleges together are males?
(a) 50.49%
(b) 55.89%
(c) 60.69%
(d) 65.29%
(e) 70.09%
5. In which one of the given colleges are there the highest number of female students?
(a) V
(b) U
(c) T
(d) R
(e) None of these
Data Interpretation Question for IBPS Clerk 2015 Answers
1. (b)
The required total number of female students
\(\left( \begin{array}{l} { \frac { 40 }{ 100 } \times 60+\frac { 50 }{ 100 } \times 150\frac { 45 }{ 100 } \times 120+\frac { 40 }{ 100 } \times 180 } \\ { +\frac { 40 }{ 100 } \times 150+\frac { 30 }{ 100 } \times 60 } \end{array} \right) \)
= (24 + 75 + 54 + 72 + 60 + 18) = 303
2. (c)
\(= \left[ \left( 1 – \frac { 35 } { 100 } \right) 120 + \left( 1 – \frac { 35 } { 100 } \right) \times 180 \right]\)
\(= \left[ \frac { 40 } { 100 } \times 150 + \frac { 35 } { 100 } \times 60 \right]\)
= (78 + 117) : (60 + 21) = 195 : 81
= 65 : 27
3. (a)
The required difference
\(\begin{array} { l } { \left[ \left( 1 – \frac { 45 } { 100 } \right) \times 180 + \left( 1 – \frac { 35 } { 100 } \right) \times 120 + \left( 1 – \frac { 40 } { 100 } \right) \times 60 \right] } \\ { + \left[ \left( 1 – \frac { 40 } { 100 } \right) \times 90 + \left( 1 – \frac { 35 } { 100 } \right) \times 180 + \left( 1 – \frac { 50 } { 100 } \right) \times 120 \right] } \end{array}\)
= (99 + 78 + 36) + (54 + 117 + 60)
= 213 + 231 = 444
4. (c)
Total number of students in CSE of all the colleges together
= (180 + 120 + 160 + 90 + 180 + 60 + 180) = 870
Number of males students in CSE of all the colleges together
= (99 + 78 + 36 + 45 + 117 + 36 + 117) = 528
∴ The required percentage
\(= \frac { 528 } { 870 } \times 100 \% \approx 60.69 \%\)
5. (a)
Data Interpretation Question for IBPS Clerk 2014 Exam
Study the following table carefully and answer the questions given below:
Number of bales of wool processed by 5 woollen mills
| Name of the Company | |||||
| Month | Polar | Shephered | Kiwi | Warmwear | Comfy |
| Jan | 900 | 850 | 350 | 1000 | 850 |
| Feb | 800 | 700 | 1050 | 1100 | 850 |
| March | 1050 | 800 | 1000 | 1100 | 950 |
| April | 800 | 850 | ‘ 850 | 1100 | 850 |
| May | 950 | 900 | 1050 | 1150 | 850 |
| Total | 4500 | 4100 | 4900 | 5450 | 4350 |
(IBPS Bank Clerk 2014)
1. In the case of which mill is the processing of wool in March the highest percentage of the total processing by that mill during the five month period?
(a) Polar
(b) Shephered
(c) Kiwi
(d) Warmwear
(e) None of these
2. The wool-processing by Warmwear in April is what percent of its wool-processing in Janauary?
(a) 91
(b) 110
(c) 115
(d) 10
(e) None of these
3. Which of the five mills has the highest ratio of wool processing done in April to that done in February?
(a) Polar
(b) Shephered
(c) Kiwi
(d) Warmwear
(e) None of these
4. In the case of which mill is the wool-processing in February and March together the lowest among the five mills processing during the same period?
(a) Comfy
(b) Warmwear
(c) Kiwi
(d) Shephered
(e) None of these
5. The total of wool-processing done by Kiwi during the given period is approximately what per cent of that done by Shephered?
(a) 80
(b) 87
(c) 120
(d) 108
(e) None of these
Data Interpretation Question for IBPS Clerk 2014 Answers
1. (a)
Percentage processing of wool in the month of March by different companies.
Polar = 23.33%. Shephered = 19.51%,
Kiwi = 20.41%, Warmwear = 20.18%
Comfy = 21.84%
2. (b)
Reqd%
\(=\frac { 1100 }{ 1000 } \times 100=110%\)
3. (b)
If we see the table, we find that only Shepherd shows less value in February in comparison to the month of April So, it gives the maximum ratio.
4. (d)
Shephered shows the lowest processing in the month of February and March.
5. (c)
Reqd%
\(=\frac { 4900 }{ 4100 } \times 100=120%\)
Data Interpretation Question for IBPS Clerk 2013 Exam
Study the table carefully and answer the given questions.
Number of Pages Printed by 6 Printers in 5 Different Weeks (IBPS Clerk CWE 2013)
|
Printer & Week |
A | B | C | D | E | F |
| 1st | 664 | 618 | 628 | 552 | 638 | 419 |
| 2nd | 569 | 441 | 519 | 438 | 621 | 537 |
| 3rd | 440 | 614 | 503 | 527 | 541 | 742 |
| 4th | 256 | 263 | 347 | 651 | 412 | 321 |
| 5th | 717 | 429 | 598 | 582 | 519 | 693 |
1. What is the respective ratio between the number of pages printed by Printer B in 2nd week and the number of pages printed by Printer F in 5th week?
(a) 4 : 9
(b) 11 : 13
(c) 9 : 13
(d) 7 : 11
(e) 9 : 11
2. What is the average number of pages printed by all the given printers in 4th week?
(a) 375
(b) 425
(c) 415
(d) 430
(e) 390
3. Which of the following printer printed maximum number of pages in all the given weeks together?
(a) Printer A
(b) Printer E
(c) Printer D
(d) Printer C
(e) Printer F
Data Interpretation Question for IBPS Clerk 2013 Answers
1. (d)
Ratio = 7 : 1
\(=\frac { number\quad of\quad pages\quad printed\quad by\quad printer\quad B\quad in\quad 2nd\quad week }{ number\quad of\quad pages\quad printed\quad by\quad printer\quad F\quad in\quad 5th\quad week } \)
2. (b)
Average number of pages printed by all the printer
\(= \frac { 256 + 563 + 347 + 651 + 412 + 321 } { 6 } = 425\)
3. (c)
|
Printer & Week |
A | B | C | D | E | F |
| 1st | 664 | 618 | 628 | 552 | 638 | 419 |
| 2nd | 569 | 441 | 519 | 438 | 621 | 537 |
| 3rd | 440 | 614 | 503 | 527 | 541 | 742 |
| 4th | 256 | 263 | 347 | 651 | 412 | 321 |
| 5th | 717 | 429 | 598 | 582 | 519 | 693 |
| Total up to 5th week | 2646 | 2365 | 2595 | 2750 | 2731 | 2712 |
Printer D printed maximum pages.
Leave a Reply