Data Interpretation Question for IBPS RRB
Data Interpretation Question for IBPS RRB 2017 Exam
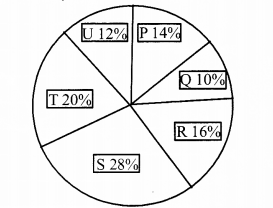
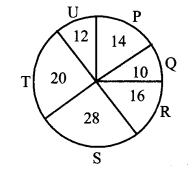
Given below is the pie chart which shows the percentage distribution of the book ‘XYZ’ publishes in 5 different stores. (IBPS RRB Scale-I Prelim Exam 2017)
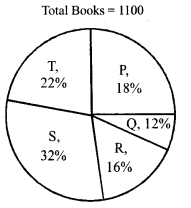
1. If a number of female who bought the books in store T are 42 more than number of males who bought books from same store then find the number of females who bought book in store T.
(a) 148
(b) 178
(c) 142
(d) 168
(e) 173
2. Find the central angle for the book S.
(a) 117.5°
(b) 115.2°
(c) 112.8°
(d) 108.5°
(e) 118.8°
3. If total books of another publisher ‘MNP’ is 20% more than books of ‘XYZ’ publisher then what will be total books sold by store P and Q for publisher ‘MNP’. Percentage- distribution for different stores for MNP remains the same as fa-‘XYZ’
(a) 400
(b) 378
(c) 381
(d) 386
(e) 3%
4. What is the ratio of total books sold by store P and R together to the total books sold by store S and T together
(a) 17:27
(b) 18:29
(c) 21:28
(d) 22:23
(e) 24:29
5. What is the difference between the average of a book sold by store P and T together and average books sold by store R and S together?
(a) 33
(b) 11
(c) 22
(d) 44
(e) 20
Read the following table carefully and answer the following questions. (IBPS RRB Scale-I Prelim Exam 2017)
No. of students and % of students passed out of those who appeared are given for two subjects from year 2011 to 2015 in a college XYZ.
|
Year |
Statistics | Economics | ||
| No. of students appeared | % of students passed | No. of students appeared | % of students passed | |
| 2011 | 2200 | 45% | 4200 | 40% |
| 2012 | 2700 | 55% | 3800 | 45% |
| 2013 | 2500 | 35% | 2600 | 60% |
| 2014 | 3200 | 65% | 4800 | 55% |
| 2015 | 4800 | 60% | 2200 | 50% |
6. Find the average number of students who were failed in Economics in year 2012 and year 2013 together?
(a) 1435
(b) 1565
(c) 1720
(d) 1590
(e) None of these
7. Number of students failed in Statistics in the year 2013 is what % of the number of students failed in Economics in the same year?
(a) 145.75%
(b) 150%
(c) 156.25%
(d) 158.25%
(e) None of these
8. Find the ratio between the total number of students appeared in Economics from 2012 to 2014 together and the total number of students appeared in Statistics from year 2013 to 2015 together?
(a) 13:14
(b) 14:13
(c) 15:16
(d) 16:15
(e) None of these
9. Find the difference between the total number of students passed in Statistics from year 2012 and total number of students failed in Economics from year 2015.
(a) 690
(b) 385
(c) 485
(d) 550
(e) 610
10. Find the average number of students appeared in Economics from year 2011 to 2014 together?
(a) 3090
(b) 3015
(c) 3060
(d) 3075
(e) 3850
Study the following line graph carefully and answer the following questions. The number of boys and the number of girls are given. They are visiting a place from Monday to Friday.
(IBPS RRB Scale-I Prelim Exam 2017)
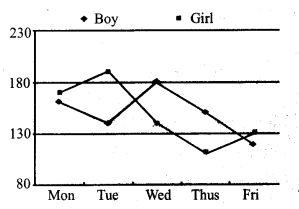
11. Find the ratio of the total number of boys visited the place’ on Tuesday and Thursday together to the total number of girls visited the place on Monday and Friday together?
(a) 29 : 30
(b) 30 : 29
(c) 25 : 26
(d) 26 : 25
(e) None of these
12. Total number of boys and girls together visited the place on Tuesday are what percent more/less than the total number of boys and girls together visited the place on Thursday?
\(\left( a \right) 26\frac { 12 }{ 13 } %\)
\(\left( b \right) 25\frac { 3 }{ 13 } %\)
\(\left( c \right) 26\frac { 3 }{ 13 } %\)
\(\left( d \right) 25\frac { 7 }{ 13 } %\)
(e) None of these
13. Find the difference between the total number of girls visited the place from Monday to Wednesday and the total number of boys visited the place from Wednesday to Friday?
(a) 30
(b) 60
(c) 40
(d) 50
(e) None of these
14. If on Saturday the number of boys and number of girls increased by 25% and 20% respectively as compared to that on Friday then find the total number of boys and girls together visited the place on Saturday?
(a) 196
(b) 306
(c) 316
(d) 206
(e) 216
15. Total number of boys and girls visited the place on Monday and Tuesday together is how much more than the total number of boys and girls visited the place on Thursday and Friday together?
(a) 175
(b) 125
(c) 150
(d) 160
(e) 130
Study the following table carefully to answer the questions that follow. (IBPS RRB Scale-I Main Exam 2017)
The table shows the online and offline contestants taking part in a survey from four villages and total contestant who have not completed the survey (online and offline)
Note 1: Total contestants in a village= Online contestants + Offline contestants
2: Total contestants in a village = Contestants who complete the survey + contestants who do not complete survey
| Village | Online Contestants | Offline Contestants | Contestants who do not complete the survey (online + offline) |
| P | 700 | 44% | 244 |
| Q | 1120 | 65% | 184 |
| R | 930 | 40% | 216 |
| s | 960 | 60% | 380 |
16. In village P, if the number of online and offline contestants who didn’t complete the survey are equal, then online contestants from village P who completed the survey are what percent (approximate) more than offline contestants who completed the survey from the same village?
(a) 47%
(b) 52%
(c) 35%
(d) 31%
(e) 37%
17. Total number of contestants from village R who completed the survey are how much more or less than total number of contestants who completed the survey from village Q?
(a) 1682
(b) 1857
(c) 1737
(d) 1851
(e) 1660
18. If ratio of online & offline contestants who didn’t completed the survey in village ‘S’ is 8 : 11 and 65% of online contestants who completed the survey are male and 60% of offline contestants who complete the survey are female, then find the difference between females of online contestants who completed the survey and males of offline contestants who completed the survey ?
(a) 202
(b) 288
(c) 208
(d) 308
(e) None of these
19. Find the difference between the number of offline contestants of village R and that T village P.
(a) 65
(b) 80
(c) 88
(d) 70
(e) None of these
20. Find sum of the difference between total number, of online and offline contestants who participated in the survey from all four villages.
(a) 1900
(b) 1980
(c) 1960
(d) 1735
(e) 1840
21. The number of offline and online contestant together who completed the survey from village R are approximate what percent of total participants on survey from village S?
(a) 52%
(b) 62%
(c) 48%
(d) 56%
(e) 58%
Study the following pie charts and answer the questions that follow: (IBPS RRB Scale-I Main Exam 2017)
Given below are two pie charts which show the percentage distribution of cricket players and football players in 6 sports club out of the total cricket and football players respectively in these six sports club.
Note:
(1) If it is said that number of players playing “either” football or cricket then it means sum of players playing football and cricket.
(2) Number of players plays both games
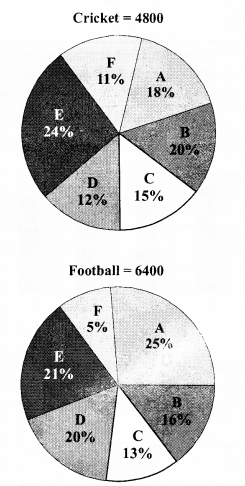
22. What is the difference between the total number of players playing either Football or Cricket from club D and those playing Football from club C and E together?
(a) 352
(b) 320
(c) 365
(d) 372
(e) None of these
23. The ratio of male to female players who play either Cricket or Football from club E is 9 : 7. Male players of club E playing either Cricket or Football are what percent of club F players playing Football?
(a) 408.75%
(b) 437.25%
(c) 438.75%
(d) 416%
(e) None of these
24. 5/12Ih of club E players playing Cricket are male and 7/13th of club C players playing football are male. Find the sum of total number of female players from club E playing Cricket and total females from club C playing Football.
(a) 1056
(b) 1032
(c) 1048
(d) 1520
(e) 1022
25. Players of club D and B who play Football are what percent (approximate) more or less than club D and F players playing Cricket?
(a) 112%
(b) 115%
(c) 105%
(d) 109%
(e) 95%
26. Find the difference in the number of players playing Cricket from club A and C together and those playing Football from club B, D and F together.
(a) 1115
(b) 1040
(c) 1025
(d) 1020
(e) 1215
The bar graph given below shows the percentage of valid voters in 5 villages in two years 2011 and 2015. Study the graph carefully to answer the based questions. (IBPS RRB Scale-I Main Exam 2017)
NOTE – Total voters in any year = Valid voters + Invalid voters
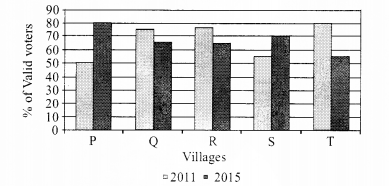
27. What is the difference between invalid voters of village R in the two given years if valid voters in 2015 in that village are 8000 which is more than valid voters of the same village in 2011.
(a) 2190
(b) 3250
(c) 2580
(d) 2550
(e) 2565
28. If in village P in 2015, 5000 voters were declared invalid voters 10% of valid voters opted NOTA and the winner got 400 more votes than losing candidate, then find the total vote that losing candidate got in 2015 in village P.
(a) 8800
(b) 8600
(c) 8400
(d) 9200
(e) 9800
29. In village Q if the total voters in 2011 were 13 \(\frac { 1 } { 23 } \%\) more than total voters in 2015, then find the ratio of invalid voters in 2011 to the invalid voters in 2015 in same village.
(a) 131:160
(b) 130:161
(c) 127:141
(d) 18:35
(e) None of these
30. If there are 3200 males in valid voters of village T in 2011 and the females in valid voters of same village and same year contributed is 36% of total valid voters, then find the percentage of invalid male voters in total population if total males in village T in 2011 were 4000.
(a) 16.2%
(b) 12.4%
(c) 14.6%
(d) 12.8%
(e) 14.8%
31. If the ratio of valid voters of village Q in 2011 and invalid voters of village S in 2015 was 25:3, then total voters of village S in 2015 were what percent more or less than those of village Q in 2011?
(a) 65%
(b) 60%
(c) 70%
(d) 55%
(e) 75%
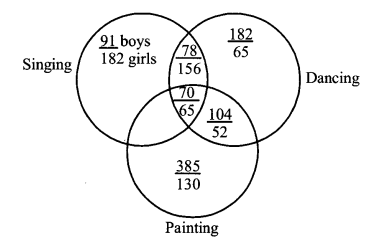
Study the following data to answer the questions that follow. (IBPS RRB Scale-I Main Exam 2017)
A school consisting of a total of 1560 students have boys and girls in the ratio of 7 : 5 respectively. All the students are enrolled in different types of hobby classes, viz., Singing, Dancing and Painting. One-fifth of the boys are enrolled in only Dancing classes. Twenty percent of the girls are enrolled in only Painting classes. Ten percent of the boys are enrolled in only Singing classes. Twenty-four percent of the girls are enrolled in both Singing and Dancing classes together. The number of girls enrolled in only Singing classes is two hundred percent of the boys enrolled in the same. One-thirteenth of the boys are enrolled in all the three classes together. The respective ratio of boys enrolled in Dancing and Painting classes together to the girls enrolled in the same is 2 : 1 respectively. Ten percent of the girls are enrolled in only Dancing classes whereas eight percent of the girls are enrolled in both Dancing and Painting classes together. The remaining girls are enrolled in all the three classes together. The number of boys enrolled in Singing and Dancing classes together is fifty percent of the number of girls enrolled in the same. The remaining boys are enrolled in only Painting classes.
32. Total number of girls enrolled in Singing is approximately what percent of the total number of students in the school?
(a) 37
(b) 19
(c) 32
(d) 14
(e) 26
33. What is the respective ratio of the number of girls enrolled in only Painting classes to the number of boys enrolled in the same?
(a) 77 : 26
(b) 21 : 73
(c) 26 : 77
(d) 73 : 21
(e) None of these
34. Number of girls enrolled in only Dancing classes is what percent of the boys enrolled in the same?
(a) 38.67
(b) 35.71
(c) 41.83
(d) 28.62
(e) None of these
35. What is the total number of boys who are enrolled in Dancing?
(a) 318
(b) 364
(c) 292
(d) 434
(e) None of these
36. What is the total number of students enrolled in all the three classes together?
(a) 135
(b) 164
(c) 187
(d) 142
(e) None of these
Study the table and answer the given questions. (IBPS RRB Scale- 2 & 3 2017 Main Exam)
Total Exports of Six Countries over Five Years (in ₹ crore)
|
Year → Country ↓ |
2012 | 2013 | 2014 | 2015 | 2016 |
| A | 20 | 40 | 60 | 45 | 90 |
| B | 30 | 25 | 15 | 50 | 100 |
| C | 50 | 55 | 70 | 90 | 65 |
| D | 45 | 60 | 20 | 15 | 25 |
| E | 60 | 50 | 55 | 100 | 110 |
| F | 24 | 40 | 60 | 75 | 120 |
Note: Profit = Exports – Imports
37. What was the profit of all countries together in the year 2016 if the total imports of all the countries together was ₹ 385 crore?
(a) 125
(b) 160
(c) 280
(d) 240
(e) 200
38. If the respective ratio of export to import in country D and country F is 1 : 2 and 4 : 1 in the year 2012, then what is the total imports of country F and D together in that particular year? (in ₹ crore)
(a) 52
(b) 22
(c) 36
(d) 96
(e) 44
39. If the export of country A in the year 2017 is 20% more than the total exports of country B in 2015 and export of country E in 2014 together, then what was the profit of A in the year 2017 if it’s imports were ₹ 92 crore for that year? (in ₹ crore)
(a) 10
(b) 58
(c) 22
(d) 46
(e) 34
40. By what percent the average export of country E over all the given years more than the average export of country C over all the given years?
\(\left( a \right) 13\frac { 7 }{ 11 } %\)
\(\left( b \right) 9\frac { 1 }{ 11 } %\)
\(\left( c \right) 13\frac { 5 }{ 7} %\)
\(\left( d \right) 4\frac { 7 }{ 11 } %\)
\(\left( e \right) 12\frac {1 }{7} %\)
41. What is the percent increase in the exports of all the countries together in the year 2013 to 2015? (Rounded off to two digits after decimal)
(a) 88.99
(b) 72.39
(c) 38.89
(d) 62.89
(e) 40.60
Refer to the pie-chart and the table and answer the given questions. (IBPS RRB Scale- 2 & 3 2017 Main Exam)
Distribution of Total Number of Cellular Phones (Both Redmi and Samsung) Sold by Six Stores in October
| Store | Respective Ratio of Number of Redmi Cellular Phone Sold to the Number of Samsung Cellular Phone Sold |
| P | 4 : 3 |
| 0 | 3 : 1 |
| R | 5 : 4 |
| S | 7 : 6 |
| T | 1 : 4 |
| U | 11 : 10 |
42. What is the average number of Redmi cellular phones sold by stores P, R, S and T together ?
(a) 1007
(b) 1048
(c) 3908
(d) 1006
(e) 996
43. Number of Redmi cellular phones sold by store R is what percent more than the total number of Samsung cellular phones sold by stores P and Q together?
\(\left( a \right) 23\frac { 1 }{ 17 } %\)
\(\left( b \right) 19\frac { 5 }{ 17 } %\)
\(\left( c \right) 20\frac { 3 }{ 17 } %\)
\(\left( d \right) 17\frac { 11 }{ 17 } %\)
\(\left( e \right) 4\frac { 24 }{ 119 } %\)
44. What is the central angle corresponding to total number of cellular phones (both Redmi and Samsung) sold by store S?
(a) 99.2°
(b) 93.6°
(c) 100.8°
(d) 97.4°
(e) 101.2°
45. What is the respective ratio between number of Redmi cellular phones sold by store S and total number of Samsung cellular phones sold by stores T and U together?
(a) 43 : 72
(b) 49 : 76
(c) 43 : 76
(d) 49 : 72
(e) None of these
46. Total number of cellular phones (both Redmi and Samsung) sold by stores Q increased by 15% from October to November and total number of cellular phones (both Redmi and Samsung) sold by store T increased by 5% from October to November. What was the total number of cellular phones sold by stores Q and T together in November ?
(a) 3540
(b) 3720
(c) 3640
(d) 3420
(e) 3880
Study the following graph and answer the given questions (IBPS RRB Scale-2 & 3 2017 Main Exam)
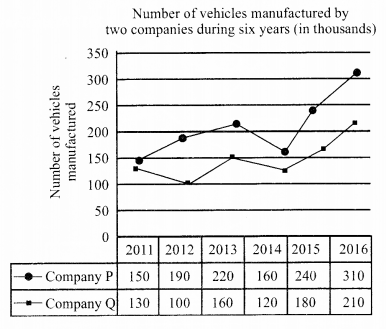
47. What is the difference between total number of vehicles manufactured by company P in 2013,2014 and 2016 together and company Q in 2014, 2015 and 2016 together ? (in thousands)
(a) 120
(b) 210
(c) 100
(d) 270
(e) 180
48. What is the average number of vehicles manufactured by company Q over six years? (in thousands)
(a) 170
(b) 150
(c) 90
(d) 60
(e) 130
49. What is the percentage decrease in number of vehicles manufactured by both companies from 2013 to 2014?
\(\left( a \right) 45\frac { 3 }{ 11 } %\)
\(\left( b \right) 33\frac { 3 }{ 11 } %\)
\(\left( c \right) 26\frac { 6 }{ 19 } %\)
\(\left( d \right) 27\frac { 3 }{ 11 } %\)
\(\left( e \right) 33\frac { 4 }{ 11 } %\)
50. Out of the number of vehicles manufactured by company P in 2015, 15000 pieces were found defective and out of the number of vehicles manufactured by company Q in 2016, 10000 pieces were found defective. What is the respective ratio of non-defective vehicles manufactured by company Pin 2015 and Q in the 2016?
(a) 9 : 8
(b) 11 : 4
(c) 3 : 8
(d) 5 : 8
(e) 7 : 4
51. In year 2017, there was an increase of 30% in number of vehicles manufactured by company P as compared to vehicles manufactured by same company in the year 2012. What is the total number of vehicles manufactured by the same company in the year 2017?
(a) 247
(b) 297
(c) 211
(d) 310
(e) 283
Data Interpretation Question for IBPS RRB 2017 Answers
1. (c)
Let male who purchased book from Store T = x
Then
\(\mathrm { x } + \mathrm { x } + 42 = \frac { 22 } { 100 } \times 1100\)
x = 100
Required number of females = 100 + 42 = 142
2. (b)
According to question,
\(\frac { 18 } { 5 } = \frac { x } { 32 }\)
\(x = \frac { 18 \times 32 } { 5 }\)
= 18 × 6.4
= 115.2°
3. (e)
According to question,
Total books of store
\(\mathrm { XYZ } = \frac { 120 } { 100 } \times 1100 = 1320\)
Total books sold by store P and Q
(18% + 12 %) of 1320
\(= \frac { 30 = 1320 } { 100 } = 396\)
4. (a)
According to question,
Required ratio = (18 % + 16 %) : (32 % + 22 %)
= 34 : 54
= 17 : 27
5. (d)
According to question,
Required difference
\(= \frac { 1 } { 2 } [ ( 32 \% + 16 \% ) – ( 18 \% + 22 \% ) ] = 1100\)
\(= \frac { 1 } { 2 } = 8 \% = 1100\)
= 4 % × 1100
= 44
6. (b)
According to question,
No. of students failed in Economics in year 2012
\(= \frac { ( 100 – 45 ) } { 100 } = 3800 = 2090\)
No. of students, failed in Economics in year 2013
\(= \frac { ( 100 – 60 ) } { 100 } = 2600 = 1040\)
Required average
\(= \frac { 2090 + 1040 } { 2 } = 1565\)
7. (c)
According to question,
No. of students failed in Statistics in year 2013
\(= \frac { 100 – 35 } { 100 } = 2500 = 1625\)
No. of students failed in Economics in year 2013
\(= \frac { 100 – 60 } { 100 } \times 2600 = 1040\)
Required %
\(= \frac { 1625 } { 1040 } \times 100 = 156.25 \%\)
8. (d)
According to question,
Total no. of students appeared in Economics from 2012 to 2014
= 3800 + 2600 + 4800 = 11200
Total no. of students appeared in Statistics from 2013 to 2015
= 2500 + 3200 + 4800 = 10500
Required ratio = 11,200 : 10,500
= 16 : 15
9. (b)
According to question
Total no. of students passed in Statistics in year 2012
\(= \frac { 55 } { 100 } \times 2700 = 1485\)
Total no. of students failed in Economics in year 2015
\(= \frac { 50 } { 100 } \times 2200\)
= 1100
Required difference = 1485 – 1100
= 385
10. (e)
According to question,
Average no. of students appeared in Economics from year 2011 to 2014 together
\(= \frac { 4200 + 3800 + 2600 + 4800 } { 4 }\)
\(= \frac { 15400 } { 4 } = 3850\)
11. (a)
According to question,
Total no. of boys visited on Tuesday and Thursday = 140 + 150 = 290
Total no. of girls visited on Monday and Friday = 170 + 130 = 300
Required ratio = 290 : 300
= 29 : 30
12. (a)
According to question, total no. of boys and girls together on Tuesday = 140 + 190 = 300
Total no. of boys and girls together on Thursday = 150 + 110 = 260
Required %
\(= \frac { 330 – 260 } { 260 } \times 100 = 26 \frac { 12 } { 13 } \%\)
13. (d)
According to question, total no. of girls visited from Monday to Wednesday
= 170 + 190 + 140 = 500
Total no. of boys visited from Wednesday to Friday
= 180 + 150 + 120 = 450
Required difference = 500 – 450 = 50
14. (b)
According to question,
On Saturday –
Total no. of boys visited the place
\(= \frac { 125 } { 100 } = 120 = 150\)
Total no. of girls visited the place
\(= \frac { 120 } { 100 } = 130 = 156\)
Required boys and girls = 150 + 153 = 306
15. (c)
According to question,
Total boys and girls visited the place on Monday and Tuesday together
= 160 + 140 + 170 + 160 = 660
Total boys and girls visited the place on Thursday and Friday together
= 150 + 120 + 110 + 130 = 510
Required no. of persons = 660 – 510 = 150
16. (c)
According to question,
Offline contestant in village Painting
\(= \frac { 700 } { 56 } \times 44 = 550\)
Online contestant who complete the survey = 700 – 122 = 578
Offline contestant who complete the survey = 550 – 122 = 428
∴ Required %
\(= \frac { 578 – 428 } { 428 } \times 100 \approx 35 \%\)
17. (a)
According to question,
Total no. of contestant from village R who complete the survey
\(= \left[ 930 + \left( \frac { 930 } { 60 } \times 40 \right) \right] – 216 = 1334\)
Total no. of contestant from village Q who complete the survey
\(= \left[ 1120 + \left( \frac { 1120 } { 35 } \times 65 \right) \right] – 184 = 3016\)
∴ Required number = (3016 – 1334) = 1682
18. (c)
According to question,
Online contestant who didn’t complete the survey
\(= \frac { 8 } { 19 } \times 380 = 160\)
Offline contestant who didn’t completed the survey
\(= \frac { 11 } { 19 } \times 380 = 220\)
∴ Males in online contestant who completed the survey
\(= \frac { 65 } { 100 } \times ( 960 – 160 ) = 520\)
and
Females in offline contestant who completed the survey
\(= \frac { 60 } { 100 } \times \left( \frac { 960 } { 40 } \times 60 – 220 \right) = 732\)
∴ Required difference
= (1440 – 220 – 732) – (960 – 160 – 520)
⇒ 488 – 280 = 208
19. (d)
Offline contestants of village R
\(= \frac { 930 } { 60 } \times 40 = 620\)
Offline contestants of village Painting
\(= \frac { 700 } { 56 } \times 44 = 550\)
∴ Required difference = (620 – 550) = 70
20. (a)
According to question,
Required sum
\(= \frac { 700 } { 56 } \times 12 + \frac { 1120 } { 35 } \times 30 + \frac { 930 } { 60 } \times 20 + \frac { 960 } { 40 } \times 20\)
= 150 + 960 + 310 + 480 = 1900
21. (d)
According to question
Number of said contestants from village R
\(= \frac { 930 } { 60 } \times 100 – 216\)
= 1334
and number of said contestants from village S
\(= \frac { 960 } { 40 } \times 100 = 2400\)
∴ Required percentage
\(= \frac { 1334 } { 2400 } \times 100 = 56 \%\)
22. (b)
According to question,
Male players from club ‘E’ who play either of cricket or football.
\(= 4800 \times \frac { 12 } { 100 } + 6400 \times \frac { 20 } { 100 }\)
⇒ 576 + 1280 = 1856
Players of football from both club ‘C’ and ‘E’
\(= 6400 \times \frac { ( 13 + 21 ) } { 100 } = 2176\)
∴ Required difference = (2176 – 1856) = 320
23. (c)
According to question,
Male players from club ‘E’ who play either of cricket or football
\(\Rightarrow \left[ 4800 \times \frac { 24 } { 100 } + 6400 \times \frac { 21 } { 100 } \right] \times \frac { 9 } { 16 }\)
\(\Rightarrow \quad ( 1152 + 1344 ) \times \frac { 9 } { 16 }\)
\(\Rightarrow \quad 2496 \times \frac { 9 } { 16 } = 1404\)
Players from club ‘F’ who playing football
\(= 6400 \times \frac { 5 } { 100 } = 320\)
∴ Required difference
\(= \frac { 1404 } { 320 } \times 100 = 438.75 \%\)
24. (a)
According to question
Female players of cricket from club ‘E’
\(= 4800 \times \frac { 24 } { 100 } \times \frac { 7 } { 12 } = 672\)
Female players of football from club ‘C’
\(= 6400 \times \frac { 13 } { 100 } \times \frac { 6 } { 13 } = 384\)
∴ Required Sum = 672 + 384 = 1056
25. (d)
According to question,
Players of club D and B who play football
\(= 6400 \times \frac { 36 } { 100 } = 2304\)
Players of club D and F who playing cricket
\(= 4800 \times \frac { 23 } { 100 } = 1104\)
∴ Required %
\(= \frac { ( 2304 – 1104 ) } { 1104 } \times 100 \approx 108.65 \% = 109 \%\)
26. (b)
According to question,
Players who play cricket from both A and C
\(= 4800 \times \frac { 33 } { 100 } = 1584\)
Players who playing football from club B, D and F together
\(= 6400 \times \frac { 41 } { 100 } = 2624\)
∴ Required difference = 2624 – 1584 = 1040
27. (c)
According to question,
Invalid voter of village R in 2015
\(= 8000 \times \frac { 36 } { 64 } = 4500\)
Valid voter of village R in 2011
\(= 8000 \times \frac { 19 } { 25 } = 6080\)
Now, invalid voter of village R in 2011
\(= 6080 \times \frac { 24 } { 76 } = 1920\)
∴ Required difference = 4500 – 1920 = 2580
28. (a)
According to question,
Total valid votes of village P in 2015
\(= 5000 \times \frac { 100 } { 20 } \times \frac { 80 } { 100 } = 20,000\)
Total, valid votes excluding NOTA in village P in 2015
\(= 20,000 \times \frac { 90 } { 100 } = 18,000\)
Now, according question,
x + (x + 400) = 18,000
x = 8800
∴ Required number of votes of losing candidates = 8800
29. (b)
Let the total voters in 2015 be x.
Total voters in 2011
\(= \left( 1 + \frac { 3 } { 23 } \right) \mathrm { x } = \frac { 26 \mathrm { x } } { 23 }\)
∴ Required ration
\(\frac { x \times \frac { 26 } { 23 } \times \frac { 25 } { 100 } } { x \times \frac { 35 } { 100 } } = \frac { 130 } { 161 }\)
30. (d)
Total valid male of village T in 2011 = 4000 – 3200 = 800
Total valid voters in 2011
\(= 3200 \times \frac { 100 } { 64 } = 5000\)
Total voters in 2011
\(= 5000 \times \frac { 100 } { 80 } = 6250\)
∴ Required %
\(= \frac { 800 } { 6250 } \times 100 = 12.8 \%\)
31. (c)
Let total voters of village Q in 2011 = x and
Total voters of village S in 2015 = y
∴ \( \frac { x \times \frac { 75 } { 100 } } { y \times \frac { 30 } { 100 } } = \frac { 25 } { 3 }\)
∴ \(\quad \frac { \mathrm { x } } { \mathrm { y } } = \frac { 50 } { 15 }\)
∴ Required %
\(= \frac { 35 } { 50 } \times 100 = 70 \%\)
Solutions (32 – 36)
Number of boys = 910 and
Number of girls = 650
32. (e)
Required %
\(= \frac { ( 182 + 156 + 65 ) } { 1560 } \times 100 \approx 26 \%\)
33. (c)
Required ratio = 130 : 385 = 26 : 77
34. (b)
Required %
\(= \frac { 65 \times 100 } { 182 } = 35.71 \%\)
35. (d)
Required number (78 + 182 + 70 + 104) = 434
36. (a)
Required number = (70 + 65) = 135
Solutions (37 – 41)
| Year → Country ↓ | 2012 | 2013 | 2014 | 2015 | 2016 |
| A | 20 | 40 | 60 | 45 | 90 |
| B | 30 | 25 | 15 | 50 | 100 |
| C | 50 | 55 | 70 | 90 | 65 |
| D | 45 | 60 | 20 | 15 | 25 |
| E | 60 | 50 | 55 | 100 | 110 |
| F | 24 | 40 | 60 | 75 | 120 |
37. (a)
Given, import of all countries = ₹ 385 Crore
Now, Export of all countries = 90 + 100 + 65 + 25 + 110 + 120 = 510 = ₹ 510 crore
∴ Profit all countries together = 510 – 385 = 125 = ₹ 125 crore
38. (d)
For country D, import
\(= 45 \times \frac { 2 } { 1 } \)
= ₹ 90 Crore
For country F, import
\(= 24 \times \frac { 1 } { 4 } \)
= ₹ 6 crore
Thus, the total imports of country F and D together = 90 + 6 = ₹ 96 crore
39. (e)
Total export of country B in 2015 = ₹ 50 crore
Total export of country E in 2015 = ₹ 55 crore
∴ Together total export = 50 + 55 = ₹ 105 crore
∴ Total export of country A in 2017
\(= 105 \times \frac { 120 } { 100 }\)
= ₹ 126 crore
Given, import of country A in 2017 = ₹ 92 crore
∴ Profit of country A in year 2017
= Export – Import
= 126 – 92 = ₹ 34 crore
40. (a)
Average export of country E
\(\frac { 60 + 50 + 55 + 100 + 110 } { 5 } = \frac { 375 } { 5 } = 75\)
Average export of country
\(\frac { 50 + 55 + 70 + 90 + 65 } { 5 } = \frac { 330 } { 5 } = 66\)
∴ Required percentage
\(= \frac { 9 } { 66 } = 100 = \frac { 150 } { 11 } = 13 \frac { 7 } { 11 }\)
41. (c)
∴ Difference = 375 – 270 = 105
∴ Percentage growth
\(= \frac { 105 } { \text { Total export in } 2013 } \times 100\)
\(= \frac { 105 } { 270 } = 100 = \frac { 350 } { 9 } = 38.89\)
Solutions (42 – 46)
42. (a)
According to question
Total Number = 11200
| Store | Redmi / Samsung |
| P | 4 : 3 |
| Q | 3 : 1 |
| R | 5 : 4 |
| S | 7 : 6 |
| T | 1 : 4 |
| U | 11 : 10 |
Total % of (P + R + S + T) together = 78 %
Number of Redmi sold by store P
\(= \frac { 4 } { 7 } \times 14 \times \frac { 11200 } { 100 } = 8 \times \frac { 11200 } { 100 } = 896\)
Number of Redmi sold by store R
\(= \frac { 5 } { 9 } \times 16 \times \frac { 11200 } { 100 } = \frac { 80 \times 112 } { 9 } = 996\)
Number of Redmi sold by store S
\(= \frac { 7 } { 13 } \times \frac { 28 } { 100 } \times 11200 = 14 \times 112 = 1688\)
Number of Redmi sold by store T
\(= \frac { 1 } { 5 } = \frac { 20 } { 100 } = 11200 = 448\)
Total Redmi phone sold by
(P + R + S + T) = 896 + 996 + 1688 + 448 = 4028
∴ \( \quad Required\quad average\quad =\quad \frac { 4028 }{ 4 } =1007\)
43. (e)
Samsung phone sold by store P
\(= \frac { 3 } { 7 } \times \frac { 14 } { 100 } \times 11200 = 672\)
Samsung phone sold by store Q
\(\frac { 1 } { 4 } \times \frac { 10 } { 100 } \times 11200 = 280\)
Total Samsung sold by (P + Q) = 672 + 280 = 952
Total Redmi Phone sold by R = 996
Difference = 996 – 952 = 44
Required percentage,
\(= \frac { 44 } { 952 } = 100 = \frac { 44 = 25 } { 238 } = \frac { 22 = 25 } { 119 }\)
\(= \frac { 550 } { 119 } = 4 \frac { 24 } { 119 }\)
44. (c)
We know, 100 % = 3600
So, 1 = 3.6 %
So, 28 % = 28 × 3.6 = 100.80
45. (e)
Number of Redmi phones sold by store S = 1688 (approx)
Total Number of Samsung phone sold by store T
\(= \frac { 4 } { 5 } = \frac { 20 } { 100 } = 11200 = 1792\)
Total Number of Samsung phone sold by store U
\(= \frac { 10 } { 21 } \times \frac { 12 } { 100 } \times 11200 = 640\)
∴ Required ratio
= 1688 : (1792 + 640)
= 1688:2432 = 211 : 304
46. (c)
Total Number of cellular phones sold by stores Q in October
\(= \frac { 10 } { 100 } \times 11200 = 1120\)
Sold in November
\(= 1120 \times \frac { 115 } { 100 } = 1288\)
Total Number of cellular phones sold by T in October
\(= \frac { 20 } { 100 } = 11200 = 2240\)
Sold in November
\(= 2240 = \frac { 105 } { 100 } = 2352\)
Total phone sold = 2352 + 1288 = 3640
Solutions: (47 – 51)
47. (e)
Total number of vehicles produced by Pin 2013, 2014 and 2016=690
Produced by Q in year 2014, 2015 and 2016 = 510
∴ Difference = 690 – 510 = 180 thousands
48. (b)
Average Number of vehicles by company
\(\mathrm { Q } = \frac { 130 + 100 + 160 + 120 + 180 + 210 } { 6 }\)
\(=\frac { 900 }{ 6 } =150\quad thousands\)
49. (c)
Total number of vehicles in 2013 = 380
Total number of vehicles produced in 2014 = 280
Percentage Decrease
\(= \frac { 100 } { 380 } = 100 = \frac { 500 } { 19 } = 26 \frac { 6 } { 19 } \%\)
50. (a)
Total vehicles produced by P in 2015 = 240 thousand
Defective =15 thousands
Non – defective = 225 thousands
Total vehicles produced by Q in 2016 = 210 thousand
Defectives = 10000
Non-detective = 200 thousand
∴ Required Ratio = 225 : 200 = 9 : 8
51. (a)
Number of vehicles produced by P in the year 2012 = 190
Number of vehicles produced in 2017
\(= 190 = \frac { 130 } { 100 } = 247\)
Data Interpretation Questions for IBPS RRB 2014 Exam
Study the following graph carefully to answer these questions. (IBPS CWE RRB OS 2014)
Quantity of Various Items Sold and Price per kg
imggg
1. If the quantity sold of item D increased by 50% and the price reduced by 10%. What was the total value of the quantity sold for item D ?
(a) ₹ 675
(b) ₹ 6750
(c) ₹ 67550
(d) ₹ 67500
(e) None of these
2. Approximately, what is the average price per kg of items A, B & C ?
(a) ₹ 9.50
(b) ₹ 8
(c) ₹ 7.50
(d) ₹ 9
(e) ₹ 10.50
3. What is the ratio between the total values of quantity sold for items E & F respectively?
(a) 15 : 14
(b) 3 : 2
(c) 5 : 7
(d) 7 : 5
(e) None of these
4. Total value of the quantity sold for item C is what percent of the total value of the quantity sold for item E?
(a) 111
(b) 85
(c) 90
(d) 87.5
(e) None of these
5. If the price as well as the quantity sold is increased by 20% for item A, what is the total value of quantity sold for item A?
(a) ₹ 48500
(b) ₹ 49000
(c) ₹ 42000
(d) ₹ 50400
(e) None of these
Data Interpretation Questions for IBPS RRB 2014 Answers
1. (d)
Total value of the quantity sold for item D
\(= \frac { 40 \times 150 } { 100 } \times \frac { 12.5 \times 90 } { 100 } \times 100 = 60 \times 11.25 \times 100\)
= ₹ 67500
2. (e)
Average price per kg. of items A, B and C
\(= \frac { ( 17.5 + 10 + 7.5 ) } { 3 } = \frac { 35 } { 3 }\)
= ₹ 11.668 ≈ 10.50 (approx)
3. (a)
Total value of quantity sold for item E = 15 × 25 × 100 = 37500
Total value of quantity sold for item F = 10 × 35 × 100 = 35000
4. (e)
Total value of the quantity sold for item C = 45 × 100 × 7.50 = 33750
Total value of the quantity sold for item E = 22.5 × 100 × 15 = 33750
∴ Required percentage
\(= \frac { 33750 } { 33750 } \times 100 = 100 \%\)
5. (d)
Required price
\(= 20 \times 100 \times \frac { 120 } { 100 } \times \frac { 17.5 \times 120 } { 100 } = 2400 \times 21\)
= ₹ 50400
Leave a Reply