Data Interpretation Question for IBPS PO
Data Interpretation Question for IBPS PO 2017 Exam
Study the following table carefully to answer the questions that follow. (IBPS PO Prelim 2017 Exam)
Monthly Rent (in X thousand) at five different places in six different year
| Years | Place | ||||
| Churchgate | Dadar | Kandivali | Borivali | Virar | |
| 2005 | 5.3 | 3.8 | 1.5 | 2.7 | 1.1 |
| 2006 | 12.5 | 8.3 | 3.4 | 4.8 | 2.1 |
| 2007 | 16.7 | 11.7 | 5.5 | 6.6 | 1.8 |
| 2008 | 20.9 | 13.6 | 9.8 | 12.7 | 3.6 |
| 2009 | 25.8 | 14.5 | 11.5 | 14.1 | 5.5 |
| 2010 | 30.3 | 20.9 | 15.6 | 15.9 | 7.8 |
1. In which place did the monthly rent not increase consistently from year 2005 to 2010?
(a) Churchgate
(b) Dadar
(c) Kandivali
(d) Borivali
(e) Virar
2. In which year at Churchgate, the monthly rent increased more than 100 per cent from the previous year?
(a) 2006
(b) 2007
(c) 2008
(d) 2009
(e) 2010
3. What was the difference between the monthly rent at Dadar in the year 2009 and Borivali in the year 2007?
(a) ₹ 7,600
(b) ₹ 7,900
(c) ₹ 8,100
(d) ₹ 8,600
(e) None of these
4. Monthly rent at Kandivali in the year 2008 was approximately what per cent of the total monthly rent at Virar over all the years together?
(a) 30
(b) 33
(c) 38
(d) 42
(e) 45
5. Which city was most expensive in terms of rent?
(a) Churchgate
(b) Dadar
(c) Kandivali
(d) Borivali
(e) Virar
Study the given graph carefully to answer the questions that follow: (IBPS PO Prelim 2017 Exam)
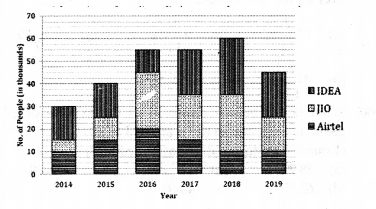
6. What is the average number of people using mobile service of JIO for all the years together?
\((a)\frac { 162 }{ 3 } \)
\((b)\frac { 144441 }{ 6 } \)
\((c)\frac { 166662 }{ 3 } \)
(d) None of these
7. The total number of people using all the three mobile services in the year 2017 is what percent of the total number of people using all the three mobile services in the year 2018? (rounded off to two digits after decimal)
(a) 89.72
(b) 93.46
(c) 88.18
(d) 91.67
(e) None of these
8. The number of people using mobile service of Idea in the year 2016 forms approximately what percent of the total number of people using all the three mobile services in that year?
(a) 18
(b) 26
(c) 11
(d) 23
(e) 29
9. What is the ratio of the number of people using mobile service of AIRTEL in the year 2015 to that of those using the same service in the year 2014?
(a) 8:7
(b) 3:2
(c) 19:13
(d) 15:11
(e) None of these
10. What is the total number of people using mobile service of JIO in the years 2018 and 2019 together?
(a) 35,000
(b) 30,000
(c) 45,000
(d) 25,000
(e) None of these
Given below is the table which shows the total students in 4 different schools and percentage of students participating in Song and Play in 4 different classes. (IBPS PO Prelim 2017 Exam)
| Classes | Total Students | % of students participating | |
| Song | Play | ||
| VI | 1500 | 15 | 8 |
| VII | 1400 | 10 | 6 |
| VIII | 1360 | 25 | 10 |
| IX | 1250 | 10 | 12 |
11. What is the ratio of students participating in Song from Class VII and IX together to the students participating in Play from class VI and VIII together?
(a) 143 :153
(b) 165 :156
(c) 144:157
(d) 163:171
(e) 162:177
12. What is the average of students in Play from all the classes?
\(\left( a \right) 122\frac { 1 }{ 2 } \)
\(\left( b \right) 134\frac { 1 }{ 2 } \)
\(\left( c \right) 127\frac { 1 }{ 2 } \)
\(\left( d \right) 135\frac { 1 }{ 2 } \)
\(\left( a \right) 130\frac { 1 }{ 2 } \)
13. Students who are participating in Song from class VII are what percent more or less than students who are participating is Play from class IX.
\(\left( a \right) 2\frac { 2 }{ 7 } %\)
\(\left( b \right) 4\frac { 2 }{ 7 } %\)
\(\left( c \right) 6\frac { 2 }{ 3 } %\)
\(\left( d\right) 6\frac { 1 }{ 4 } %\)
\(\left( e \right) 66\frac { 2 }{ 3 } %\)
14. What is the sum of students who do not participate in Song and Play from class VI and IX together?
(a) 2720
(b) 2120
(c) 2240
(d) 2130
(e) None of these
15. What is the difference of students participating in song from class VIII and IX together to the students participating in Play from same class together?
(a) 179
(b) 182
(c) 199
(d) 188
(e) 204
Abar graph is given below which shows two types of mobiles sold by seller P and seller Q on five days. (IBPSPO Prelim 2017 Exam)
Number of m mobiles sold by P Number of m mobiles sold by Q
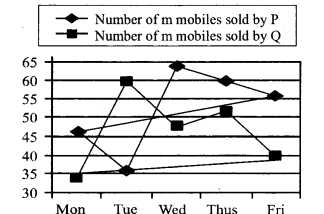
16. The total number of mobiles sold by P and Q together on Wednesday is how much percentage more than the number of mobiles sold by P and Q together on Tuesday?
\(\left( a \right) 15\frac { 2 }{ 3 } %\)
\(\left( b \right) 8\frac { 1 }{ 3 } %\)
\(\left( c\right) 16\frac { 2 }{ 5 } %\)
\(\left( d \right) 16\frac { 2 }{ 3 } %\)
\(\left( e \right) 21\frac { 3 }{ 7 } %\)
17. If number of mobiles sold on Friday by P is increased by \(14\frac { 2 }{ 7 } %\), then what will be the average no. of mobiles sold on Monday, Wednesday, and Friday by P?
(a) 85
(b) 58
(c) 56
(d) 82
(e) 52
18. Find the number of mobiles sold on Saturday by P and Q together, if number of mobiles sold on Saturday is \(7\frac { 1 }{ 7 } %\) more than the mobiles sold on Thursday by P and Q together? .
(a) 110
(b) 114
(c) 116
(d) 118
(e) 120
19. What is the difference between the number of mobiles sold on Monday and Wednesday by Q to the number of mobiles sold on Friday by both P & Q together?
(a) 9
(b) 12
(c) 14
(d) 21
(e) 24
20. P sold 80% defective mobiles on Thursday and Q sold 75% defective mobiles on the same day. Find the number of mobiles sold by P and Q on Thursday that are not defective?
(a) 25
(b) 20
(c) 18
(d) 32
(e) 40
21. Find the ratio of number of mobiles sold by P on Tuesday & Friday together to number of mobiles sold by Q on same days.
(a) 25:23
(b) 23:25
(c) 21:25
(d) 25:21
(e) 18:17
Study the table and answer the given questions. (IBPS PO Mains 2017 Exam)
Data related to the number of employees in five different companies in December 2012
| Company | Total number of Employees | Out of the total number of employees | ||
| Percentage of Science graduates | Percentage of
Commerce graduates |
Percentage of Arts graduates | ||
| M | 1050 | 32% | . | . |
| N | 700 | – | 31% | 40% |
| O | – | 30% | 30% | – |
| P | – | – | 40% | 20% |
| Q | – | 35% | 50% | – |
Note: (I) Employees of the given companies can be categorised only in three types: Science graduates, Commerce graduates and Arts graduates
(II) A few values are missing in the table (indicated). A candidate is expected to calculate the missing value, if it is required to answer the given question, on the basis of the given data and information.
22. What is the difference between the number of Arts graduate employees and Science graduate employees in Company N?
(a) 87
(b) 89
(c) 77
(d) 81
(e) 73
23. The average number of Arts graduate employees and commerce graduate employees in Company Q was 312. What was the total number of employees in Company Q?
(a) 920
(b) 960
(c) 1120
(d) 1040
(e) 1080
24. If the ratio of the number of Commerce graduate employees to that of Arts graduate employees in Company M was 10 : 7, what was the number of Arts graduate employees in M?
(a) 294
(b) 266
(c) 280
(d) 308
(e) 322
25. The total number of employees in Company N increased by 20% from December 2012 to. December 2013. If 20% of the total number of employees in Company N in December 2013 were Science graduates, what was the number of Science graduate employees in company N in December 2013?
(a) 224
(b) 226
(c) 294
(d) 252
(e) 168
26. The total number of employees in Company P was 3 times the total number of employees in Company O. If the difference between the number of Arts graduate employees in Company P and that in Company O was 180, what was the total number of employees in Company O?
(a) 1200
(b) 1440
(c) 720
(d) 900
(e) 1080
Study the following pie-chart and table carefully and answer the questions given below: (IBPS PO Mains 2017 Exam)
Percentage-wise distribution of the number of mobile phones sold by a shopkeeper for six months
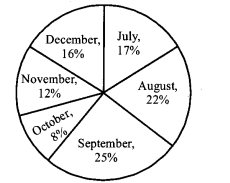
The ratio between the numbers of mobile phones sold by Company A and Company B during six months
| Month | Ratio |
|
July |
08:7 |
| August | 04:5 |
| September | 03:2 |
| October | 07:5 |
| November | 07:8 |
| December | 07:9 |
27. What is the ratio of the number of mobile phones sold by Company B during July to those sold during December of the same company?
(a) 119:145
(b) 116:135
(c) 119:135
(d) 119:130
(e) None of these
28. If 35% of the mobile phones sold by Company A during November were sold at a discount, how many mobile phones of Company A during that month were sold without a discount?
(a) 882
(b) 1635
(c) 1638
(d) 885
(e) None of these
29. If the shopkeeper earned a profit of ₹ 433 on each mobile phone sold by Company B during October, what was his total profit earned on the mobile phones of that company during the same month?
(a) ₹ 6,49,900
(b) ₹ 6,45,900
(c) ₹ 6,49,400
(d) ₹ 6,49,500
(e) None of these
30. The number of mobile phones sold by Company A during July is approximately what percent of the number of mobile phones sold by Company A during December?
(a) 110
(b) 140
(c) 150
(d) 105
(e) 130
31. What is the total number of mobile phones sold by Company B during August and September together?
(a) 10000
(b) 15000
(c) 10500
(d) 9500
(e) None of these
The following information is about the production of cars by 3 different companies from Monday to Friday in a specific week. Read the information carefully and answer the following question: (IBPS PO Mains 2017 Exam)
The total production by 3 companies on Monday was 540 out of which 100/3% cars were produced by Tata. The number of cars produced by Renault on Monday is less than the cars produced by Tata on Monday by the same extent as the number of cars produced by Maruti on Monday is more than the cars produced by Tata on Monday. The difference between cars produced by Renault and Maruti on Monday is 40.150 cars are produced by Tata on Tuesday, which is 100 less than the cars produced by the same company on Wednesday. A total of 910 cars were produced by Tata from Monday to Friday. The ratio between cars produced by Tata on Thursday to cars produced by the same company on Friday is 5 : 6. 220 cars were produced by Renault on Tuesday, which is 80 less than the cars produced by Maruti on Wednesday. A total of 570 cars were produced on Tuesday, which is 76% of the total cars produced on Wednesday. The number of cars produced by Maruti on Thursday is 200/3% more than cars produced by Tata on the same day. Total 580 cars were produced on Thursday. The number of cars produced by Maruti on Friday is same as that on Monday. 140 cars were produced by Renault on Friday.
32. Find the ratio between total cars produced on Monday to that on Wednesday.
(a) 18 : 29
(b) 18 : 25
(c) 18 : 31
(d) 3 : 5
(e) None of these
33. Find the total number of cars produced by Renault from Monday to Friday.
(a) 900
(b) 980
(c) 950
(d) 960
(e) None of these
34. Find the average number of cars produced per day by Maruti from Monday to Friday, (approximate)
(a) 250
(b) 220
(c) 270
(d) 240
(e) 230
35. On which pair of days out of the following, the number of cars produced by Tata is the same?
(a) Tuesday and Wednesday
(b) Wednesday and Thursday
(c) Tuesday and Thursday
(d) Monday and Wednesday
(e) Monday and Tuesday
36. On which day the total number of cars produced was the maximum?
(a) Monday
(b) Tuesday
(c) Wednesday
(d) Thursday
(e) Friday
Data Interpretation Question for IBPS PO 2017 Answers
1. (e)
It is clear from the table.
2. (a)
Percent increase in 2006
\(= \frac { 12.5 – 5.3 } { 5.3 } \times 100 \approx 136\)
3. (b)
Required difference = (14.5 – 6.6) × 1000 = ₹ 7900
4. (e)
Total monthly rent at Virar over all the years together
= (1.1 +2.1 + 1.8 + 3.6+ 5.5 + 7.8) × 1000 = 21900
∴ \(\quad Required\quad percent\quad =\frac { 9800 }{ 21900 } =100\approx 45\)
5. (a)
It is clear from tha table.
6. (c)
Average
\(= \frac { 1 } { 6 } = [ 5 + 10 + 25 + 20 + 25 + 15 ] = 1000\)
\(= \frac { 100000 } { 6 } = 16666 \frac { 2 } { 3 }\)
7. (d)
Required%
\(=\frac { 55 }{ 60 } =100=91.67%\)
8. (a)
Required%
\(=\frac { 10 }{ 55 } =100=18%({ approx. })\)
9. (b)
Required ratio =15 : 10 = 3 : 2
10. (e)
Required no. of people = (25 + 15) × 1000 = 40000
11. (b)
Required ratio
\(= \frac { \frac { 10 } { 100 } \times 1400 + \frac { 10 } { 100 } \times 1250 } { \frac { 8 } { 100 } \times 1500 + \frac { 10 } { 100 } \times 1360 }\)
= 165 : 156
12. (a)
Required average
\(= \frac { \frac { 8 } { 100 } \times 1500 + \frac { 6 } { 100 } \times 1400 + \frac { 10 } { 100 } \times 1360 + \frac { 12 } { 100 } \times 1250 } { 4 }\)
\(\Rightarrow \quad \frac { 120 + 84 + 136 + 150 } { 4 } = \frac { 490 } { 4 } = 122 \frac { 1 } { 2 }\)
13. (c)
Students participating in Song from class VII
\(= \frac { 10 } { 100 } = 1400 = 140\)
Students participating in Song from class IX
\(= \frac { 12 } { 100 } = 1250 = 150\)
Required Percentage
\(= \frac { 10 } { 150 } = 100 = \frac { 100 } { 15 } \% = \frac { 20 } { 3 } \% = 6 \frac { 2 } { 3 } \%\)
14. (d)
Students who don’t participate in Song and Play from class VI
\(= 1500 – ( 15 \% + 8 \% ) \text { of } 1500\)
\(= 1500 – \frac { 23 } { 100 } = 1500\)
= 1500 – 345
=1155
Students who do not participate in Song and Play in class IX
= 1250 – (10% + 12%) × 1250
= 1250-275
= 975
Required sum = 1155 + 975 =2130
15. (a)
According to question,
Students who participate in Song from class VIII and IX together
\(=\left( \frac { \pi 1360\times 25 }{ 100 } +\frac { 1250\times 10 }{ 100 } \right) =340+125=465\)
Student who participate in play from class VII and IX together
\(=\left( \frac { \pi 1360\times 10 }{ 100 } +\frac { 1250\times 12 }{ 100 } \right) =136+150=286\)
Required difference = (465 – 286) = 179
16. (d)
According to question,
Total no. of mobiles sold on Wednesday = 64 + 48 = 112
Total no. of mobiles sold on Tuesday = 60 + 36 = 96
\(Required\quad Percentage\quad =\frac { 112-96 }{ 96 } =100\)
\(= 16 \frac { 2 } { 3 } \%\)
17. (b)
According to question,
No. of mobiles sold on Friday by P after increase
\(= 56 = \frac { 8 } { 7 } = 64\) .
Average no. of mobiles sold on Monday, Wednesday and Friday by P
\(= \frac { 46 + 64 + 64 } { 3 } = \frac { 174 } { 3 } = 58\)
18. (e)
According to question,
No. of mobiles sold on Saturday,
\(= 112 = \frac { 15 } { 14 } = 120\)
19. (c)
According to question,
No. of mobiles sold on Monday and Wednesday by Q = 34 + 48 = 82
No. of mobiles sold on Friday by P and Q together = 56 + 40 = 96
Required difference = 96 – 82 = 14
20. (a)
According to question,
Mobiles sold on Thursday that are not defected
\(= \frac { 20 } { 100 } = 60 + \frac { 25 } { 100 } = 52\)
12+ 13 = 25
21. (b)
According to question,
No. of mobiles sold on Tuesday and Friday by P = 36 + 56 = 92
No. of mobiles sold on Tuesday and Friday by Q = 60 + 40= 100
Required ratio = 92 : 100 = 23 : 25
22. (c)
Total number of employees in company N = 700
Percentage of Science graduate employees = [ 100-(31 +40)] = 29%
Now, percentage difference between Arts graduate and science graduate employees
= (40-29)%= 11%
11% of 700 = 77
Therefore, difference = 77
23. (b)
The percentage of Arts graduate employees in
Company Q = 100 – 35 – 50 = 15%
Now, the percentage of Arts graduate employees and Commerce and Arts = 50+ 15 = 65%
Average = 312
Therefore, the total number of employees in commerce and Arts = 2 × 312
Let the total employees in Company Q be x
Then, 65% of x= 2 × 312
x = 960
24. (a)
The percentage of commerce graduate and Arts
graduate employees in company M = 100 – 32 = 68%
Now, the percentage of Arts graduates employees
\(= \frac { 68 = 7 } { 17 } = 28 \%\)
The percentage of Commerce graduate employees 68 = 10
\(= \frac { 68 = 10 } { 17 } = 40 \%\)
The number of arts graduate employees in Company
\(M = \frac { 1050 = 28 } { 100 } = 294\)
25. (e)
The number of employees in Company N in December
2012 = 700
The number of employees in company N in
\(December\quad 2013\quad =\frac { 700\times 120 }{ 100 } =840\)
Number of Science graduate employees in company N in
\(December\quad 2013\quad =\frac { 20=840 }{ 100 } =168\)
26. (d)
The percentage of Arts graduate employees in company
O = 100 – 30 – 30 = 40%
The percentage difference between Arts graduate employees in company O and P = 40 – 20 = 20%
Now, let the number of employees in company O be x
Then, x × 20% = 180
x = 900
27. (c)
Total number of mobiles sold in the month of July
\(= 45000 = \frac { 17 } { 100 } = 7650\)
Mobiles phones sold by Company B in the month of July
\(= 7650 = \frac { 7 } { 15 } = 3570\)
Total numbers of mobile phones sold in the month of December
\(= 45000 = \frac { 16 } { 100 } = 7200\)
Mobile phones sold by Company B in the month of December
\(= 7200 = \frac { 9 } { 16 } = 4050\)
∴ Required ratio
\(= \frac { 3570 } { 4050 } = \frac { 357 } { 405 } = \frac { 119 } { 135 } = 119 : 135\)
28. (c)
Number of mobile phones sold in the month of November
\(= 45000 = \frac { 12 } { 100 } = 5400\)
Number of mobile phones sold by Company A in the month of November
\(= 5400 = \frac { 7 } { 15 } = 2520\)
∴ Number of mobile phones sold without discount in the month of November by Company A
\(= 2520 = \frac { 65 } { 100 } = 2520 = 0.65 = 1638\)
29. (d)
Number of mobile phones sold in the month of October
\(= 45000 \times \frac { 8 } { 100 } = 3600\)
∴ Number of mobile phones sold by Company B in the month of October
\(= 3600 = \frac { 5 } { 12 } = 1500\)
∴ Total profit earned by Company B in the month of October = 1500 × 433 = 649500
30. (e)
Number of mobile phones sold in the month of July
\(= 45000 = \frac { 17 } { 100 } = 7650\)
Number of mobile phones sold by Company A in the month of July
\(= 7650 = \frac { 8 } { 15 } = 4080\)
Number of mobile phones sold in the month of 16 December
\(= 45000 = \frac { 16 } { 100 } = 7200\)
Number of mobile phones sold by Company A in the month of December
\(= 7200 = \frac { 7 } { 16 } = 3150\)
∴ Required % \(=\frac { 4080 }{ 3150 } =100=129.52\approx 130\)
31. (a)
Number of mobile phones sold in the month ofAugust
\(= \frac { 22 } { 100 } = 45000 = 9900\)
Number of mobile phones sold in the month of September
\(= \frac { 25 } { 100 } \times 45000 = \frac { 1 } { 4 } \times 45000 = 11250\)
Number of mobile phones sold by Company B in the month of August
\(= 9900 = \frac { 5 } { 9 } = 5500\)
Number of mobile phones sold by Company B in September
\(= 11250 = \frac { 2 } { 5 } = 4500\)
Total number of mobile phones sold in August and September by Company B = 5500 + 4500 = 10000
| Monday | Tuesday | Wednesday | Thursday | Friday | |
| Tata | 180 | 150 | 250 | 150 | 180 |
| Renault | 160 | 220 | 200 | 180 | 140 |
| Maruti | 200 | 200 | 300 | 250 | 200 |
| 540 | 570 | 750 | 580 | 520 |
32. (b)
Required ratio
\(= \frac { 540 } { 750 } = 18 : 25\)
33. (a)
Total number of cars produced by Renault from monday to Friday = 900
34. (e)
Required average
\(= \frac { 1150 } { 5 } = 230\)
35. (c)
No. of cars produced on Tuesday and Thursday is same i.e. 150.
36. (c)
Maximum number of cars produced = 750, on Wednesday.
Data Interpretation Question for IBPS PO 2016 Exam
The graph below shows the end of the month market values of 4 shares for the period from January to June. Answer the following questions based on this graph (IBPS PO Pre 2016)
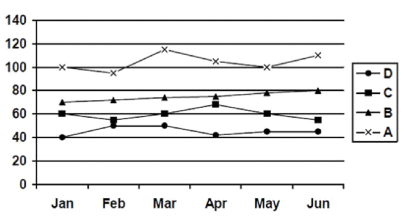
1. Which share showed the greatest percentage increase in market value in any month during the entire period?
(a) A
(b) B
(c) C
(d) D
(e) Both a and b
2. In which month was the greatest absolute change in market value for any share recorded?
(a) March
(b) April
(c) May
(d) June
(e) Feb
3. In which month was the greatest percentage increase in market value for any share recorded?
(a) February
(b) March
(c) April
(d) May
(e) June
4. An individual wishes to sell 1 share of C and 1 share of D to buy 1 share of A at the end of a month. At which month-end would the individual’s loss from this decision, due to share value changes, be the most?
(a) February
(b) March
(c) April
(d) June
(e) Jan
5. An individual decides to sell 1 share of C and 1 share of D to buy 1 share of A at the end of the month. What can be the individual’s greatest gain from this decision, due to share value changes?
(a) 5
(b) 10
(c) 15
(d) none
(e) 20
Study the following graph carefully to answer the questions given below (IBPS PO Pre 2016)
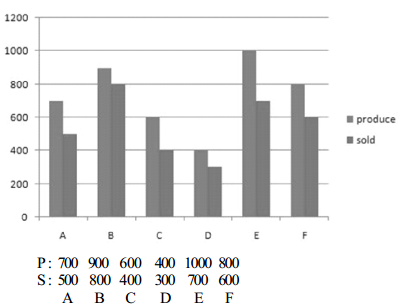
6. What is the average number of units produce by all companies together ?(approx)
(a) 700
(b) 720
(c) 733
(d) 740
(e) 750
7. Which company had the lowest percentage of sales with respect to its production ?
(a) Company A
(b) Company B
(c) Company C
(d) Company D
(e) Company E
8. What is the ratio of the total production of the company B and C together to the total sales of the same companies?
(a) 4:5
(b) 5:4
(c) 5:2
(d) 2:3
(e) None of these
9. The total unit sold by D, E, F together is approximately what percentage of the total units produced by these companies ?
(a) 72%
(b) 72.12%
(c) 72.22%
(d) 72.72%
(e) 73.67%
10. What is the ratio of total production of all the companies to the total sales of all the companies ?
(a) 4:3
(b) 3:4
(c) 3:2
(d) 2:3
(e) None of these
Study the following graph to answer the given questions (IBPS PO Mains 2016)
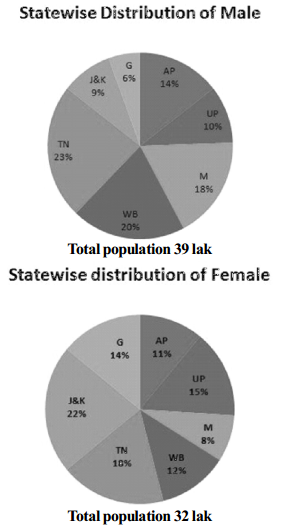
11. What is the ratio between the Female population of state UP and the male population of M?
(a) 60 : 95
(b) 80 : 117
(c) 85 : 112
(d) 45 : 77
(e) None of these
12. What is the total population of State J & K?
(a) 11.55 lak
(b) 10.65 lak
(c) 10.55 lak
(d) 9.78 lak
(e) None of these
13. Find the difference between Male population and Female population in the state WB?
(a) 5.76 lak
(b) 4.67 lak
(c) 3.69 lak
(d) 3.96 lak
(e) None of these
14. Find the average number of males in all the 7 states?
(a) 5 lak
(b) 6 lak
(c) 5.57 lak
(d) 6.57 lak
(e) None of these
15. The angle corresponding to the female population in the states AP and M?
(a) 56.9 degree
(b) 76.5 degree
(c) 48.6 degree
(d) 68.4 degree
(e) None of these
Study the following graph carefully to answer the given Questions
No of students(in hundred) who participated in three different sports in six different years (IBPS PO Mains 2016)
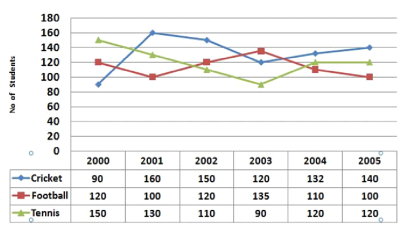
16. What is the difference between the no of players participating in Football in the year 2012 and the no of players participating in Cricket in the year 2015?
(a) 1000
(b) 2000
(c) 2200
(d) 1700
(e) 1800
17. The total no of players who participated in all the 3 sports together in the year 2014 was What % of the total no of players who participated in Tennis over all the years together (approx)?
(a) 50%
(b) 45%
(b) 47%
(d) 53%
(e) 52%
18. What was the average no of players who participated in Football over all the years together?
(a) 11417
(b) 11490
(c) 12476
(d) 10976
(e) 10990
19. What was the % decrease in the no of players participating in Cricket in the year 2003 as compared to that in the year 2001?
(a) 45%
(b) 35%
(c) 25%
(d) None of these
(e) 47%
20. Find the ratio between the no of students participated in Cricket & Football in 2001 to the total no of students participated in Cricket and Tennis in 2004 ?
(a) 20 : 17
(b) 65 : 63
(c) 60 : 43
(d) 55 : 52
(e) 52 : 55
Study the following information to answer the given questions (IBPS PO Mains 2016)
| Dept | STAFF | STUDENTS | ||
| Number | M : F | Number | M : F | |
| ECE | 120 | 13 : 11 | 1800 | 7 : 11 |
| EEE | 5O | 9 : 7 | 1500 | 7 : 8 |
| CSE | 150 | 17 : 13 | 2200 | 9 : 13 |
| IT | 90 | 4 : 5 | 600 | 7 : 5 |
| ME | 140 | 4 : 3 | 1600 | 17 : 15 |
| EIE | 70 | 18 : 17 | 1200 | 9 : 11 |
21. What is the ratio of total number of staff in ECE,EEE to the total no of students in CSE and IT ?
(a) 14:1
(b) 1:14
(c) 1:12
(d) 1:17
(e) None of these
22. The total no of male staff in IT and EIE is what % of the total number of staff in these 2 dept ?
(a) 44.5%
(b) 45.7%
(c) 47.5%
(d) 45.00%
(e) None of these
23. Total no of female students in CSE is what % more than the male students in the same Dept ?
(a) 44.45%
(b) 40.76%
(c) 40.75%
(d) 40.66%
(e) None of these
24. Find the number of female students in ME dept ?
(a) 850
(b) 650
(c) 150
(d) 750
(e) None of these
25. Find the average of total no of staff in all the dept ?
(a) 103.8
(b) 108.3
(c) 108.2
(d) 108
(e) None of these
Data Interpretation Question for IBPS PO 2016 Answers
1. (d)
From the table we clearly seen that highest % increase is for D in Feb. i.e 25%
2. (a)
The greatest absolute change in the market value is 20 i.e. In the month of March the share of A = 115 – 95 = 20
3. (a)
The greatest percentage change in any share was recorded for share D for the month of February viz. 25%
4. (d)
Due to share value changes the maximum loss is 10 for the month of June.
Hence the answer is (d).
5. (a)
From the above table again we can see that the individual’s highest gain is Rs.5.
6. (c)
Avg production
\(= \frac { ( 700 + 900 + 600 + 400 + 1000 + 800 ) } { 6 } = 733.33\)
= 733
7. (c)
\(\mathrm { A } = \frac { 500 \times 100 } { 700 } = 71.42 \%\)
\(\mathrm { B } = \frac { 800 \times 100 } { 900 } = 88.88 \%\)
\(C = \frac { 400 \times 100 } { 600 } = 66.66 \%\)
\(\mathrm { D } = \frac { 300 \times 100 } { 400 } = 75 \%\)
\(E = \frac { 700 \times 100 } { 1000 } = 70 \%\)
\(\mathrm { F } = \frac { 600 \times 100 } { 800 } = 75 \%\)
8. (b)
P = 900 + 600 = 1500
S = 800 + 400 = 1200
P : S = 1500 : ₹ 1200 = 5:4
9. (d)
S = 300 + 700 + 600 = 1600
P = 400 + 1000 + 800 = 2200
\(\mathrm { S } / \mathrm { P } = \frac { 1600 \times 100 } { 2200 } = 72.72 \%\)
10. (a)
P = 700 + 900 + 600 + 400 + 1000 + 800 = 4400
S = 500 + 800 + 400 + 300 + 700 + 600 = 3300
P : S = 4400 : 3300 = 4 : 3
11. (b)
\(F = 32 \times \frac { 15 } { 100 } = 4.8 \mathrm { lak }\)
\(M = 39 \times \frac { 18 } { 100 } = 7.02 \mathrm { lak }\)
480 : 702 = 80 : 117
12. (c)
\(\mathrm { M } = 39 \times \frac { 9 } { 100 } = 3.51 \mathrm { lak }\)
\(\mathrm { F } = 32 \times \frac { 22 } { 100 } = 7.04 \mathrm { lak }\)
Total = 10.55 = 10.55 lak
13. (d)
\(\mathrm { M } = 39 \times \frac { 20 } { 100 } = 7.8 \mathrm { lak }\)
\(\mathrm { F } = 32 \times \frac { 12 } { 100 } = 3.84\)
Diff = 7.8 – 3.84 = 3.96lak
14. (c)
\(\mathrm { AP } = 39 \times \frac { 14 } { 100 } = 5.46 \mathrm { lak }\)
\(\mathrm { UP } = 39 \times \frac { 10 } { 100 } = 3.9 \mathrm { lak }\)
\(M = 39 \times \frac { 18 } { 100 } = 7.02 \mathrm { lak }\)
\(\mathrm { WP } = 39 \times \frac { 20 } { 100 } = 7.8 \mathrm { l } \mathrm { lak }\)
\(\mathrm { TN } = 39 \times \frac { 23 } { 100 } = 8.97 \mathrm { lak }\)
\(\mathrm { J } \& \mathrm { K } = 39 \times \frac { 9 } { 100 } = 3.51 \mathrm { lak }\)
\(\mathrm { G } = 39 \times \frac { 6 } { 100 } = 2.34 \mathrm { lak }\)
Avg = 38.99/7 = 5.57 lak
15. (d)
AP + M = 11+8 = 19%
\(Angle=19\times \frac { 360 }{ 100 } =68.4{ degree }\)
16. (b)
2002 F = 12000
2005 C = 14000
D = 14000 – 12000 = 2000
17. (a)
2004 total = 132 + 110 + 120 = 36200
Tennis total = 72000
\(\% = 36200 \times \frac { 100 } { 7200 } = 50.28 \%\)
18. (a)
\(120 + 100 + 120 + 135 + 110 + \frac { 100 } { 6 } = \frac { 685 } { 6 } = 114.17\)
114.17 × 100 = 11417
19. (c)
2003 = 12000
2001 = 16000
\(\% = \frac { ( 16000 – 12000 / 16000 ) } { 100 } = 25 \%\)
20. (b)
2001 = 260
2004 = 252
R = 260:252 = 65 : 63
21. (b)
Staff = 200
Students = 2800
200: 2800 = 2:28 = 1 : 14
22. (c)
IT = 90 ⇒ 4:5 ⇒ 40 (male)
EIE = 70 ⇒ 18:17 ⇒ 36 (male)
40 + 36 = 76
Total = 90 + 70 = 160
\(76 \times \frac { 100 } { 160 } = 47.5 \%\)
23. (a)
2200 ⇒ 9:13 ⇒ 900:1300
\(400 \times \frac { 100 } { 900 } = 44.45 \%\)
24. (d)
1600 ⇒ 17 : 15 = 850 : 750(f)
25. (b)
\(\frac { ( 120 + 80 + 150 + 90 + 140 + 70 ) } { 6 } = \frac { 650 } { 6 } = 108.3\)
Data Inerpretation Question for IBPS PO 2015 Exam
Study the following table and pie chart carefully to answer the given questions.
The table shows the ratio of Hindu religion soldiers to soldiers of other religions (IBPS PO Prelim 2015)
| Name of regiment | Hindu | Other religions |
| Jat regiment | 4 | 1 |
| Sikh regiment | 3 | 5 |
| Madras regiment | 2 | 1 |
| Maratha regiment | 3 | 2 |
| Bihar regiment | 5 | 3 |
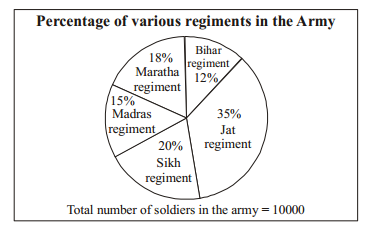
1. What is the number of Hindu soldiers in Jat regiment?
(a) 2600
(b) 2700
(c) 3200
(d) 2800
(e) 2350
2. What is the difference between Hindu soldiers in Madras regiment and soldiers of other religions in Bihar regiment?
(a) 485
(b) 550
(c) 520
(d) 510
(e) 490
3. The number of Hindu soldiers in Sikh regiment is what percent of the number of other soldiers in Maratha regiment?
(a) 97.12%
(b) 99.56%
(c) 102%
(d) 104.16%
(e) 25%
4. In which regiment is the number of non-Hindu soldiers the maximum?
(a) Maratha regiment
(b) Sikh regiment
(c) Madras regiment
(d) Jat regiment
(e) Bihar regiment
5. What is the ratio of the number of Hindu soldiers in Bihar regiment to the number of non-Hindu soldiers in Jat regiment?
(a) 11 : 10
(b) 12 : 11
(c) 13 : 12
(d) 14 : 13
(e) 15 : 14
6. If the compound interest on an amount of ₹ 29000 in two years is ₹ 9352.5, what is the rate of interest?
(a) 11
(b) 9
(c) 15
(d) 18
(e) None of these
7. Three friends A, B and C start running around a circular stadium and complete a single round in 8, 18 and 15 seconds respectively. After how many minutes will they meet again at the starting point for the first time?
(a) 12
(b) 6
(c) 8
(d) 15
(e) 18
8. The perimeter of a square is equal to the radius of a circle having area 39424 sq cm, what is the area of square?
(a) 1225 sq cm
(b) 441 sq cm
(c) 784 sq cm
(d) Can’t say
(e) None of these
Study the following graph carefully to answer these questions.
Quantity of various Items Sold and Price Per Kg. (IBPS PO Main 2015)
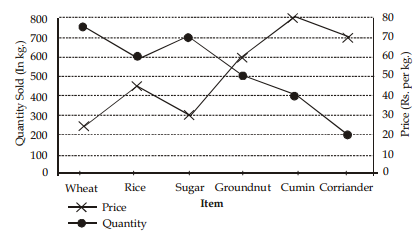
9. What is the average price per kg of wheat and rice sold? (rounded off to nearest integer)
(a) 32
(b) 34
(c) 36
(d) 35
(e) 31
10. If cumin is sold at a 10% discount, the quantity sold doubles. What will be the cost of total quantity of cumin sold on discount?
(a) ₹ 52,600/
(b) ₹ 28,800/
(c) ₹ 32,000/
(d) ₹ 57,600/
(e) None of these
11. Out of the total quantity of sugar sold, half the quantity is sold at the given rate while half the quantity is sold on a price increased by 20%. What is the total cost of entire quantity of sugar sold?
(a) ₹ 23,100/
(b) ₹ 23,800/
(c) ₹ 22,400/
(d) ₹ 23,400/
(e) None of these
12. If the quantities sold of Groundnut and Cumin are interchanged, what will be the total cost of quantities sold for these two items together?
(a) ₹ 62,000/
(b) ₹ 60000/
(c) ₹ 65,000/
(d) ₹ 63,000/
(e) None of these
13. If the quantity of corriander sold is increased by 200% and the price per kg. is reduced by 8%, what will be the total cost of corriander sold?
(a) ₹ 38, 460/
(b) ₹ 36,480/
(c) ₹ 38,640/
(d) ₹ 36,840/
(e) None of these
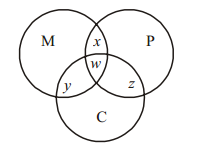
Study the following information carefully to answer these questions :
For an examination consisting of three subjects-Maths, Physics and Chemistry, 280 students appeared. When the results were declared, 185 students had passed in Maths, 210 had passed in Physics and 222 had passed in Chemistry.
All those except 5 students who passed in Maths, passed in Physics.
All those except 10 students who passed in Maths, passed in Chemistry.
47 students failed in all the three subjects.
200 students who passed in Physics also passed in Chemistry. (IBPS PO Main 2015)
14. How many students passed in Chemistry only ?
(a) 18
(b) 21
(c) 25
(d) 29
(e) None of these
15. How many students passed in all the three subjects ?
(a) 185
(b) 175
(c) 170
(d) 171
(e) Cannot be determined
16. How many students failed in Physics and Maths ?
(a) 65
(b) 18
(c) 58
(d) 47
(e) Cannot be determined
17. How many students passed in Maths but failed in both Physics and Chemistry ?
(a) 5
(b) 10
(c) 15
(d) 1
(e) Cannot be determined
18. A student has to pass in at least two subjects to get promoted. How many students get promoted ?
(a) 180
(b) 213
(c) 200
(d) 185
(e) Cannot be determined
Study the following Table carefully and answer the question given below :
MARKS OBTAINED BY DIFFERENT STUDENTS (IBPS PO Main 2015)
| Students |
SUBJECTS (Maximum Marks) |
||||||
|
Hindi (100) |
English (100) |
Maths (100) |
S.St. (100) |
Science (75) |
Sanskrit (50) |
Phy. Edu
(75) |
|
| Anupama | 85 | 95 | 87 | 87 | 65 | 35 | 71 |
| Bhaskar | 72 | 97 | 55 | 77 | 62 | 41 | 64 |
| Charu | 64 | 78 | 74 | 63 | 55 | 25 | 53 |
| Deepak | 65 | 162 | 69 | 81 | 70 | 40 | 50 |
| Garima | 92 | 82 | 81 | 79 | 49 | 30 | 61 |
| Vishal | 55 | 70 | 65 | 69 | 44 | 28 | 30 |
19. How many students have scored the lowest marks in two or more subjects ?
(a) 2
(b) 3
(c) 1
(d) 0
(e) 4
20. Who has scored the highest marks in all the subjects together ?
(a) Deepak
(b) Charu
(c) Anupama
(d) Garima
(e) Bhaskar
21. What is the percentage of Deepak’s marks (upto two digits after decimal) in all the subjects together ?
(a) 88.63
(b) 77.38
(c) 67.83
(d) 62.83
(e) 72.83
22. Marks obtained by Charu in Hindi are what percent of marks (upto two digits after decimal) obtained by Anupama in the same subject ?
(a) 75.92
(b) 78.38
(c) 77.29
(d) 75.29
(e) 72.83
23. What are the average marks obtained by all the students together in Science ?
(a) 55.75 (b) 57.5
(c) 60 (d) 59.5
(e) 58
In the following graph the number of laptops manufactured by six different companies in the years 2013 and 2014 has been given. Read the graph carefully and answer the questions.
(IBPS PO Main 2015)
24. The respective ratio between the number of laptops manufactured by Lenovo in 2013 and that by Abascus in 2014 is
(a) 8 : 7
(b) 7 : 8
(c) 3 : 5
(d) 5 : 3
(e) None of these
25. What is the average number of laptops (in thousands) manufactured by all companies taken together in 2013 ?
(a) 22
(b) 22.5
(c) 32.5
(d) 23.5
(e) 27.5
26. What is the percentage increase in production of laptops by HP in 2014 in comparison to that in 2013 ?
(a) 125
(b) 100
(c) 150
(d) 250
(e) None of these
27. The difference between the number of laptops manufactured by Apple, Lenovo and Samsung in 2013 and that by Dell, HP and Abascus in 2014 is
(a) 5500
(b) 4550
(c) 3550
(d) 4500
(e) 5000
28. In 2014, which company manufactured the maximum number of laptops?
(a) Abascus
(b) Lenovo
(c) Dell
(d) Samsung
(e) HP
Data Interpretation Question for IBPS PO 2015 Answers
1. (d)
Number of soldiers in Jat regiment = 10000 × 35% = 3500
Number of Hindu soldiers in Jat regiment
\(=3500\times \frac { 4 }{ 5 } =2800\)
2. (b)
Number of Hindu soldiers in Madras regiment = 10000
\(=10000\times 15%\times \frac { 2 }{ 3 } =1000\)
Number of soldiers of other religions in Bihar regiment
\(= 10000 \times 12 \% \times \frac { 3 } { 8 } = 450\)
So, difference
\(= 1000 – \frac { 3 } { 8 } = 450 = 550\)
3. (d)
Number of Hindu soldiers in Sikh regiment
\(=1000\times 20%\times \frac { 3 }{ 8 } =750\)
Number of soldiers of other religions in Maratha regiment
\(= 10000 \times 18 \% \times \frac { 2 } { 5 } = 720\)
So, required % = 104.16%
4. (a)
Number of non-Hindu soldiers in Jat regiment = 3500 – 2800 = 700
Similary in Sikh regiment
\(= 10000 \times 20 \% \times \frac { 5 } { 8 } = 125\)
In Madras regiment
\(= 10000 \times 15 \% \times \frac { 1 } { 3 } = 500\)
In Madras regiment
\(= 10000 \times 18 \% \times \frac { 2 } { 5 } = 720\)
In Bihar regiment
\(= 10000 \times 12 \% \times \frac { 3 } { 8 } = 450\)
In Maratha regiment the number of non-Hindu soldiers is the maximum.
5. (e)
Number of Hindu soldiers in Bihar regiment
\(=10000\times 12%\times \frac { 5 }{ 8 } =750\)
Number of non-Hindu soldiers in Jat regiment = 700
So, required ratio = 750 : 700 = 15 : 14
6. (c)
P = 29000 CI = 9352.5 N = 2 years A = P + I = 38,352.50
Substituting the values in
\(\mathrm { A } = \mathrm { P } \left( 1 + \frac { \mathrm { R } } { 100 } \right) ^ { \mathrm { n } }\)
Solving we get R = 15%.
7. ( b)
The required time will be the LCM of 8, 18 and 15 which is 360 sec or 6 minutes.
8. (c)
R2= 39424
R = 112
Perimeter of square = 4a = 112
Side of square = 112/4 = 28
Area of square = 282 = 784 cm2
9. (b)
Required average price
\(= \frac { 750 \times 25 + 600 \times 45 } { 1350 }\)
= ₹ \(\left( \frac { 18750 + 27000 } { 1350 } \right) \text { per } \mathrm { kg }\)
≈ ₹ 34 per kg
11. (d)
Required cost price
= ₹ \(\left( 800 \times \frac { 90 } { 100 } \times 80 \right)\)
= ₹ 57600
12. (a)
Total cost of entire quantity of sugar
\(=\left( 350\times 30+350\times 30\frac { 120 }{ 100 } \right) \)
= ₹ (10500 + 12600) = ₹23100
13. (e)
Required cost
= ₹ (500 × 80 + 400 × 60) = ₹ 64000
14. (c)
Total cost of corriander sold
= ₹ \(\left( 600 \times \frac { 92 } { 100 } \times 70 \right)\)
= ₹ 38640
Total Number of students = 280
Number of students who passed Maths = 185
Number of students who passed Physics = 210
Number of students who passed Chemistry = 222
Students who passed in Maths and physics = 180
Students who passed in Maths and Chemistry = 175
Students who passed in Physics and Chemistry = 200
x + w = 180….(i)
w + z = 200….(ii)
w + y = 175….(iii)
M + x + w + y = 185 ….(iv)
P + x + w + z = 210 ….(v)
C + y + w + z = 222 ….(vi)
M + P + C + y + x + z + w = 233 ….(vii)
By (iv) + (v) + (vi) – (vii),
x + y + z + 2w = 384 ….(viii)
by (i) + (ii) + (iii),
x + y + z + 3w = 555 ….(ix)
By (ix) – (viii), w = 171
From equation (i),
x = 9
From equation (ii),
z = 200 – 171 = 29
From equation (iii),
y = 175 – 171 = 4
M = 185 – 4 – 9 – 171 = 1
P = 210 – 9 – 171 – 29 = 1
C = 222 – 4 – 29 – 171 = 18
15. (a)
Number of students passed in Chemistry only = 18
16. (d)
Number of students who have passed in all three subjects = 171
17. (a)
Number of students who failed in Physics and Maths = 47 + 18 = 65
18. (d)
Number of students who passed in Maths but failed in both Physics and Chemistry = 1
19. (b)
Required answer = x + y + z + w 9 + 29 + 4 + 171 = 213
20. (a)
Charu has scored minimum marks both in Sanskrit and Social Studies.
Vishal has scored minimum marks in Science, Physical Education and Hindi.
21. (c)
Total marks obtained by :
Deepak → 65 + 62 + 69 + 81 + 70 + 40 + 50 = 437
Charu → 64 + 78 + 74 + 63 + 55 + 25 + 53 = 412
Anupama → 85 + 95 + 87 + 87 + 65 + 35 + 71 = 525
Garima → 92 + 82 + 81 + 79 + 49 + 30 + 61 = 474
Bhaskar → 72 + 97 + 55 + 77 + 62 + 41 + 64 = 468
22. (e)
Required percentage
\(= \frac { 437 } { 600 } \times 100 = 72.83\)
23. (d)
Marks obtained by Charu in Hindi = 64
Marks obtained by Anupama in Hindi = 85
Required percentage
\(= \frac { 64 } { 85 } \times 100 = 75.29\)
24. (b)
Average marks obtained in Science
\(= \frac { 65 + 62 + 55 + 70 + 49 + 44 } { 6 } = \frac { 345 } { 6 } = 57.5\)
25. (a)
Required ratio = 40 : 35 = 8 : 7
26. (b)
Required average
\(=\left( \frac { 15+25+30+40+15+10 }{ 6 } \right) thousand\)
\(=\frac { 135 }{ 6 } =22.5thousand\)
27. (c)
Required percentage increase
\(= \frac { 25 – 10 } { 10 } \times 100 = 150\)
28. (e)
Laptops manufactured by Apple, Lenovo and Samsung in 2013 = 15 + 40 + 25 = 80 thousand
Laptops manufactured by Dell, HPandAbascus in 2014
Required = 15 + 25 + 35 = 75 thousand
Difference = 5000
Data Interpretation Question for IBPS PO 2014 Exam
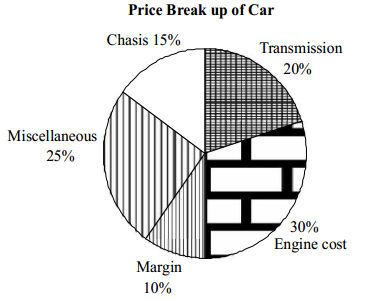
Study the pie charts given below and answer the following questions. (IBPS PO/MT CWE 2014)
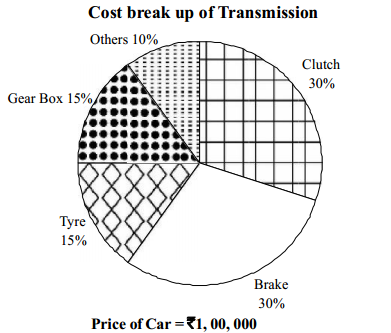
1. What is the cost of Gear Box?
(a) ₹ 9000
(b) ₹ 6000
(c) ₹ 3000
(d) ₹ 15,000
(e) None of these
2. What percentage of total cost is contributed by the brake?
(a) 5.5%
(b) 6.6%
(c) 6%
(d) 5.4%
(e) None of these
3. If the price of tyres goes up by 25%, by what amount should be the sale price be increased to maintain the amount of profit?
(a) ₹ 750
(b) ₹ 2250
(c) ₹ 3750
(d) ₹ 375
(e) None of these
4. If transmission cost increases by 20%, by what amount is the profit reduced (total price of car remains same)?
(a) ₹ 3000
(b) ₹ 4000
(c) ₹ 6000
(d) Cannot be determined
(e) None of these
5. What % of sale price is contributed by clutch?
(a) 6%
(b) 2%
(c) 3%
(d) Cannot be determined
(e) None of these
Read the following information and answer the questions that follow.
In a huge Jewellery shop, the electric gadgets being used are 17 tubelights of 40 W each, 14 fans of 80 W each, 16 bulbs of 60 W each, 11 bulbs of 100 W each, 11 AC’s of 2100 W each, 9 laptops of200 W each and 10 TV’s of 120 W each. In a day, tube lights and TV’s are used for 8 h but 60 W bulbs are used for 7 h and 100 W bulbs are used for 9 h whereas laptops and AC’s are used for 5 h and 9 h respectively. However, fans are used for 11 h. (Note: 1000 W = 1 unit, 1 month = 30 days). (IBPS PO/MT CWE 2014)
6. What is the total electric energy consumed (in units) by 60 W bulbs in the whole month?
(a) 432
(b) 576
(c) 67.2
(d) 201.6
(e) None of these
7. Electricity consumed by all fans is what percent of energy consumed by all the laptops?
(a) 132.2%
(b) 136.88%
(c) 122.68
(d) 169.62%
(e) None of these
8. Out of the following, which type of gadgets consume more electricity in the shop?
(a) Fans
(b) Tubelights
(c) Laptops
(d) TV’s
(e) None of these
9. If one electric unit costs ₹ 2.70 and power (used by AC’s) unit costs ₹ 3.70, then what money is paid to the electricity department for one month?
(a) ₹ 27368
(b) ₹ 28683
(c) ₹ 78600
(d) ₹ 2900
(e) None of these
10. What is the ratio of consumption of electricity in units by 60W and 100 W bulbs in a month?
(a) 5 : 6
(b) 4 : 5
(c) 3 : 4
(d) 2 : 3
(e) None of these
Study the following graph carefully to answer these questions.
Annual dividend offered by two companies over the years (IBPS PO/MT CWE 2014)
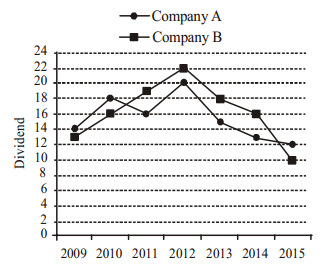
11. Shri Giridhar invested total amount of ₹ 25000 in 2009 for one year in the two companies together and got a total dividend of ₹ 3340. What was the amount invested in Company A?
(a) ₹ 12000
(b) ₹ 9000
(c) ₹ 16000
(d) Cannot be determined
(e) None of these
12. Anuja invested ₹ 35000 in Company B in 2011. After one year she transferred the entire amount with dividend to Company A in 2012 for one year. What amount will be received back by Anuja including dividend?
(a) ₹ 49980
(b) ₹ 49000
(c) ₹ 48300
(d) ₹ 49563.50
(e) None of these
13. An amount of ₹ 18000 was invested in CompanyA in 2012. After one year the same amount was re-invested for one more year. What was the total dividend received at the end of two years?
(a) ₹ 5805
(b) ₹ 6300
(c) ₹ 6480
(d) ₹ 6840
(e) None of these
14. Bhushan invested different amounts in Companies A and B in 2015 in the ratio of 5 : 8. What will be the ratio between the amounts of dividends received from Companies A and B respectively?
(a) 2 : 3
(b) 5 : 6
(c) 3 : 4
(d) Cannot be determined
(e) None of these
15. In the year 2014, Suraj invested ₹ 56000 in Company B. How much more or less dividend would he have received had the amount been invested in Company A?
(a) ₹ 1640 more
(b) ₹ 1640 less
(c) ₹ 1860 less
(d) ₹ 1680
(e) None of these
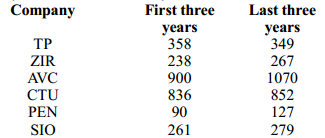
Study the following table to answer the given questions. (IBPS PO/MT CWE 2014)
| Company | Years | Total | |||||
| 2009 | 2010 | 2011 | 2012 | 2013 | 2014 | ||
| TP | 103 | 150 | 105 | 107 | 110 | 132 | 707 |
| ZIR | 75 | 80 | 83 | 86 | 90 | 91 | 505 |
| A VC | 300 | 300 | 300 | 360 | 370 | 340 | 1970 |
| CTU | 275 | 280 | 281 | 280 | 285 | 287 | 1688 |
| PEN | 25 | 30 | 35 | 40 | 42 | 45 | 217 |
| SIO | 85 | 87 | 89 | 91 | 92 | 96 | 540 |
| Total | 863 | 927 | 893 | 964 | 989 | 991 | 5627 |
16. The production of Company AVC in 2000 is approximately what per cent of its average production over the given years?
(a) 300
(b) 110
(c) 136
(d) 118.25
(e) None of these
17. For SIO, which year was the per cent increase or decrease in production from the previous year the highest?
(a) 2013
(b) 2010
(c) 2014
(d) 2012
(e) None of these
18. Which company has less average production in the last three years compared to that of first three years?
(a) No company
(b) CTU
(c) ZIR
(d) TP
(e) None of these
19. The total production of the six companies in the first two given years is what per cent of that of last two given years? (round off up to two decimal places)
(a) 87.08
(b) 104.55
(c) 90.40
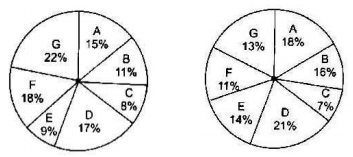
(d) 10.62
(e) None of these
20. For ZIR, which of the following is the difference between production in 2013 and that in 2014?
(a) 10,00,00,000
(b) 1,00,00,000
(c) 10,00,000
(d) 40,00,000
(e) None of these
Data Interpretation Question for IBPS PO 2014 Answers
1. (c)
\(Cost\quad of\quad gea\quad rbox\quad =\quad 20\times \frac { 1,00,000 }{ 100 } \times \frac { 15 }{ 100 } =3000\)
2. (c)
\(Cost\quad of\quad brake\quad =\frac { 20\times 1,00,000 }{ 100 } \times \frac { 30 }{ 100 } =6000\)
∴ \(\quad Required\quad percentage\quad =\frac { 6000 }{ 1,00,000 } \times 100=6.0%\)
3. (a)
\(Price\quad of\quad tyres\quad =\frac { 20\times 1,00,000 }{ 100 } \times \frac { 15 }{ 100 } =3000\)
\(Increased\quad price\quad of\quad tyres\quad =3000\times \frac { 125 }{ 100 } =3750\)
∴ Price should be increased = 3750 – 3000 = ₹ 750
4. (b)
\(Increased\quad transmission\quad cost\quad =20,000\times \frac { 120 }{ 100 } =24000\)
∴ increase in transmission cost = 24000 – 20000 = ₹ 4000
Here, this increase will reduce the profit by 4000.
5. (a)
Price of clutch = 30% of 20,000 = 6,000
∴ \(\quad Required\quad percentage\quad =\frac { 6000 }{ 1,00,000 } \times 100=6%\)
6. (d)
Total electric energy consume by 60 W bulb in whole month = 16 × 60 × 7 × 30 W = 201.6 unit
7. (b)
Electricity consumed by all fans = 14 × 80 × 11 × 30 W
Electricity consumed by all laptops = 9 × 200 × 5 × 30
Required %
\(=\frac { 14\times 80\times 11\times 30 }{ 9\times 200\times 5\times 30 } \times 100=136.88%\)
8. (a)
Electricity consumed by all fans = 14 × 80 × 11 × 30 = 369600 W
Electricity consumed by all laptops = 9 × 200 × 5 × 30 = 270000 W
Electricity consumed by all tubelights = 17 × 40 × 8 × 30 = 163200 W
Electricity consumed by all TV’s = 17 × 120 × 8 × 30 = 288000 W
Electricity consumed by 100 W bulb = 11 × 100 × 9 × 30 = 297000 W
hence fans consumed more electricity.
9. (a)
One unit cost = ₹ 2.70.
Power (used by AC’s) Unit cost = ₹ 3.70
Electricity consumed by all equipment (except AC’s)
= (201.6 + 369.6 + 270 + 163.2 + 288 + 297) unit
= (1292.4 + 297.00) unit = 1589.4 unit
Cost for these unit = 1589.4 × 2.7 = 4291.38
Electricity consumed by AC’s
= 11 × 2100 × 9 × 30 W = 623700 W = 6237 Unit
Cost for it = 6237 × 3.7 = 23076.9
Total cost = 23076.9 + 4291.38 = ₹ 27368
10. (d)
\(Required\quad ratio\quad =\frac { 201.6 }{ 297 } =\frac { 2 }{ 3 } \)
11. (b)
Suppose Giridhar invested ₹ x in company A.
∴ \(\quad \frac { x\times 14 }{ 100 } +\frac { (25000-x)\times 13 }{ 100 } =3340\)
\(or,\quad \frac { 14x }{ 100 } +3250-\frac { 13x }{ 100 } =3340\)
\(or,\quad \frac { x }{ 100 } =90\)
or, x = ₹ 9000
12. (a)
Amount of dividend received by Anuja in 2011 from company B
\(= \frac { 35000 \times 19 } { 100 }\) = ₹ 6650
Total amount invested by Anuja in 2012 in Company A
= 35000 + 6650 = ₹ 41650
\(Reqd\quad amount\quad =41650\times \frac { 120 }{ 100 } \)
= ₹ 49980
13. (b)
\(Total\quad dividend\quad =18000\times \left( \frac { 20 }{ 100 } +\frac { 15 }{ 100 } \right) \)
= ₹ 6300
14. (c)
\(Reqd\quad ratio\quad =\frac { 5\times 12 }{ 8\times 10 } =3 : 4\)
15. (d)
From the graph it is obvious that Suraj will get less dividend in 2014 from company A than from B.
Reqd less amount = 3% of 56000 = ₹ 1680
16. (b)
Production of company AVC in 2012 = 360 crore units
Average production of AVC over the given years
\(= \frac { 1970 } { 6 }\)
Hence, the required percent
\(=\frac { 360\times 6 }{ 1970 } \times 100=109.64%\approx 110%\)
17. (c)
Approximate percent increase or decrease in production from the previous year for SIO are as follows :
\(2010 = \frac { 2 } { 85 } \times 100 = 2.35 \%\)
\(2011 = \frac { 2 \times 100 } { 87 } = 2.29 \%\)
\(2012 = \frac { 2 \times 100 } { 89 } = 2.24 \%\)
\(2013 = \frac { 1 \times 100 } { 91 } = 1.09 \%\)
\(2014 = \frac { 4 \times 100 } { 92 } = 4.35 \%\)
Quicker method: See the difference of produced units between two consecutive years. The difference is maximum for 2013 to 2014, production during all these years is almost same. Hence, in the year 2014, SIO registered maximum increase in production over the previous year.
18. (d)
Sum of the productions of companies in the first three years and the last three years is as follows :
19. (c)
Total production of the six companies in first two given years = 863 + 927 = 1790
Again, total production of the six companies in last two given years = 989 + 991 = 1980
Therefore, required per cent
\(= \frac { 1790 \times 100 } { 1980 } = 90.40 \%\)
20. (b)
The required difference = (91– 92) crore units = 1 × 10000000 = 10000000 units
Data Interpretation Question for IBPS PO 2013 Exam
Study the following table carefully and answer the question given below. (IBPS PO/MT CWE 2013)
Number of People taking Fresh Loans from Different Banks over the Year and the Percentage of Defaulters Amongst them each Year
| Year | Bank | ||||
| P | Q | R | S | T | |
| 2004 | 27361 | 26345 | 25467 | 28246 | 30164 |
| 2005 | 32081 | 27456 | 32461 | 29435 | 35128 |
| 2006 | 25361 | 28637 | 32652 | 29565 | 32443 |
| 2007 | 23654 | 29045 | 32561 | 28314 | 36152 |
| 2008 | 36125 | 30467 | 25495 | 23764 | 35463 |
| 2009 | 35465 | 31963 | 27649 | 24356 | 33214 |
| 2010 | 34135 | 31974 | 28283 | 26553 | 31264 |
| Approximate Percentage of Defaulters Among them | |||||
| Year | Bank | ||||
| P | Q | R | S | T | |
| 2004 | 12 | 9 | 15 | 13 | 19 |
| 2005 | 24 | 8 | 17 | 20 | 23 |
| 2006 | 22 | 13 | 16 | 21 | 25 |
| 2007 | 18 | 11 | 18 | 22 | 19 |
| 2008 | 12 | 10 | 13 | 23 | 18 |
| 2009 | 11 | 20 | 11 | 22 | 21 |
| 2010 | 9 | 21 | 1.2 | 21 | 23 |
1. Approximately how many people taking a loan from Bank S in the year 2006 were defaulters?
(a) 6490
(b) 6210
(c) 5020
(d) 6550
(e) 5580
2. Approximately what was the difference between the number of defaulters of Bank Q in the year 2004 and 2005?
(a) 175
(b) 125
(c) 190
(d) 205
(e) 140
3. In which of the following years was the number of defaulters of Bank R, the maximum among the given years?
(a) 2005
(b) 2006
(c) 2007
(d) 2010
(e) None of these
4. In which of the following years was the difference in number of people taking loan from Bank P from the previous year the highest?
(a) 2008
(b) 2006
(c) 2007
(d) 2005
(e) None of these
5. Approximately what was the total number of defaulters of Bank T in the years 2007 and 2008 together?
(a) 14110
(b) 13620
(c) 13250
(d) 14670
(e) 15330
These questions are based on the following data. The distribution of appeared and qualified aspirants in competitive examination from different States.
Total appeard aspirants = 45000 Total qualified aspirants = 9000 (IBPS PO/MT CWE 2013)
6. What has the ratio of the number of appeared aspirants from States C and E together to that of the appeared aspirants from States A and F together?
(a) 17:33
(b) 11:13
(c) 13:27
(d) 17:27
(e) None of these
7. In which state the percentage of qualified aspirants to appeared aspirants is the least?
(a) C
(b) F
(c) D
(d) E
(e) G
8. What is the difference in the number of qualified aspirants in states D and G?
(a) 690
(b) 670
(c) 780
(d) 720
(e) None of these
9. What is the percentage of qualified aspirants with respect to appeared aspirants from states B and C taken together? (Rounded off to two decimal places.)
(a) 23.11
(b) 24.21
(c) 21.24
(d) 23
(e) None of these
10. What is the ratio between a number of candidates qualified from States B and D together and the number of candidates appeared from States ‘C’ respectively?
(a) 8 : 37
(b) 11:12
(c) 37 : 40
(d) 7 : 37
(e) None of the above
Study the following table to answer these questions. (IBPS PO/MT CWE 2013)
Plan of Public Sector Under Various Plans Sector-wise
Expenditure out of that total expenditure (in million)
| Plan | I | II | III | IV | V | VI |
| Public sector plan expenditure | 19600 | 46720 | 85770 | 157240 | 394260 | 97500 |
| Social service | 4180 | 7440 | 12960 | 24620 | 63720 | 14035 |
| Education | 1530 | 2730 | 5890 | 7860 | 13360 | 25240 |
| Health | 980 | 2140 | 2260 | 3370 | 7610 | 18210 |
| Family Planning | – | 20 | 250 | 2780 | 4920 | 10100 |
| Housing and urban services | 330 | 800 | 1280 | 2470 | 11500 | 24880 |
| Water supply and sanitation | – | – | 1060 | 4740 | 10 920 | 39220 |
| Social welfare and related area | 1340 | 1750 | 2220 | 3400 | 15 410 | 22700 |
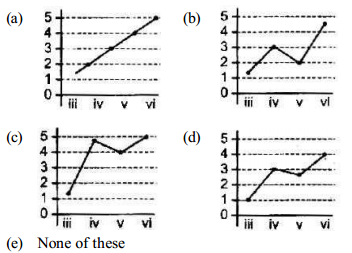
11. In various plans in the ratio of expenditure on public sector, which of the following graphs explain best the expenditure on water supply and sanitation?
12. The ratio of public sector expenditure to the expenditure on social services was highest in which plan?
(a) I
(b) VI
(c) V
(d) II
(e) None of these
13. In the successive plans in the ratio of public sector expenditure, there was a continuous decrease in which sector?
(a) In no sector
(b) Health
(c) Education
(d) Social services
(e) Social welfare and related areas
14. For plan VI out of public sector expenditure, what percent of expenditure is on Housing and Urban services?
(a) 0.35
(b) 25
(c) 25.5
(d) 2.5
(e) 20.5
15. For all the given plans, what was the difference in expenditure on education and health?
(a) ₹ 220400000
(b) ₹ 224000000
(c) ₹ 22040000000
(d) ₹ 220400000000
(e) None of these
Study the following pie chart carefully to answer the questions. (IBPS PO/MT CWE 2013)
Degree Wise Break-up of Employees Working in Various
Departments of an Organization and the ratio of Men to Women
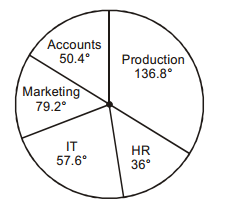
Total number of employees = 3250
Respective Ratio of Men to Women in each Department
| Department | Men | Women |
| Production | 4 | 1 |
| HR | 12 | 13 |
| IT | 7 | 3 |
| Marketing | 3 | 2 |
| Accounts | 6 | 7 |
16. What is the number of men working in the Marketing department?
(a) 462
(b) 454
(c) 418
(d) 424
(e) None of these
17. What is the respective ratio of the number of women working in the HR department to the number of men working in the IT department?
(a) 11:12
(b) 17:29
(c) 13:28
(d) 12:35
(e) None of these
18. The number of men working in the production department of the organization forms what percent of the total number of employees working in that department?
(a) 88%
(b) 90%
(c) 75%
(d) 65%
(e) None of these
19. The number of women working in the IT department of the organization forms what percent of the total number of employees in the organization from all departments together?
(a) 3.2%
(b) 4.8%
(c) 6.3%
(d) 5.6%
(e) None of these
20. What is the total number of men working in the organization?
(a) 2198
(b) 2147
(c) 2073
(d) 2236
(e) None of these
Data Interpretation Question for IBPS PO 2013 Answers
1. (b)
Required number of people = 21% of 29565
= 6208.65 = 6210
2. (a)
Required difference = 9% of 26345 – 8% of 27456
= 2371.05 – 2196.48 = 174.57 = 175
3. (c)
Number of defaulters of Bank R in the year
2004 = 15% of 25467 = 3820.05
2005 = 17% of 32461 = 5518.37
2006 = 16% of 32652 = 5224.32
2007 = 18% of 32561 = 5860.98
2008 = 13% of 25495 = 3314.35
2009 = 11% of 27649 = 3041.39
2010 = 12% of 28283 = 3393.96
Hence, maximum number of defaulters of Bank R is in the year 2007.
4. (a)
Difference of number of people taking loan from Bank
P from the previous year in the year
2005 = 32081 – 27361 = 4720 ’
2006 = 32081 – 27361 = 6720
2007 = 25361 -23654 = 1707
2008 = 36125 – 35465 = 12471
2009 = 36125-35465 = 660
2010 = 35465-34135 = 1330
Hence, the year is 2008.
5. (c)
Required number of defaulters
= 19% of 36152 + 18% of 35463
= 6868.88 + 6383.34 = 13252.22 ≈ 13250
6. (a)
Required ratio = [45000 x (8 + 9)%] : [45000 x (15 + 18)%] = 17 : 33.
7. (e)
Qualified aspirants from
\(\mathrm { C } = \frac { 9000 \times 7 \% } { 45000 \times 8 \% } \times 100 = 17.5 \%\)
From D
\(= \frac { 9000 \times 21 \% } { 45000 \times 17 \% } \times 100 = 24.70 \%\)
\(From\quad \mathrm { E } = \frac { 9000 \times 14 \% } { 45000 \times 9 \% } \times 100 = 31.11 \%\)
\(From\quad \mathrm { F } = \frac { 9000 \times 11 \% } { 45000 \times 18 \% } \times 100 = 12.22 \%\)
From G
\(= \frac { 9000 \times 13 \% } { 45000 \times 22 \% } \times 100 = 11.81 \%\)
Per cent is least in G.
8. (d)
Required difference = 9000 x (21% – 13%)
\(= 9000 \times \frac { 8 } { 100 } = 720\)
9. (b)
Required percent
\(=\frac { 9000\times (16+7)\times 100 }{ 45000\times (11+8) } =24.21%\)
10. (c)
Number of candidates qualified from State (B + D)
\(= 9000 \times \frac { ( 16 + 21 ) } { 100 } = 90 \times 37 = 3330\)
Number of candidates appeared from states 8
\(= 45000 \times \frac { 8 } { 100 } = 3600\)
\(Required\quad ratio=\frac { 3330 }{ 3600 } =37:40\)
11. (a)
From table we can say that expenditure on water supply and sanitation are increasing in every plan. So, the graph represent in option (a) is best explain of it.
12. (b)
By watching table, we see that the ratio of public sector expenditure to the expenditure on social service was highest in the Vlth plan.
13. (a)
From table, we can say that in all the sector, there is no continuous decrease.
14. (d)
\(Required\quad percentage\quad =\frac { 24880 }{ 975000 } \times 100%\)
= 2.551% = 2.5%
15. (c)
Total expenditure on education in all the plans
= 1530 + 2730 + 5890 + 7860 + 13360 + 25240
= 56610 million
Total expenditure on health in all the plans
= 980 + 2140 + 2260 + 3370 + 7610 + 18210
= 34570 million
∴ Required difference = (56610 – 34570)
= 22040 million = ₹ 22040 × 1000000 =
₹ 22040000000
16. (e)
Number of men working in the marketing department
\(3250 \times \frac { 79.2 ^ { \circ } } { 360 ^ { \circ } } \times \frac { 3 } { 5 } = 429\)
17. (c)
∴ \(\quad Required\quad ratio\quad =\frac { 3250\times \frac { 360^{ { \circ } } }{ 360^{ { \circ } } } \times \frac { 13 }{ 25 } }{ 3250\times \frac { 57.6^{ { \circ } } }{ 360^{ { \circ } } } \times \frac { 7 }{ 10 } } =13:28\)
18. (e)
Number of men working in the production department
\(= 3250 \times \frac { 136.8 ^ { \circ } } { 360 ^ { \circ } } \times \frac { 4 } { 5 } = 988\)
Total number of employees in production department
\(3250 \times \frac { 136.8 ^ { \circ } } { 360 ^ { \circ } } = 1235\)
\(Required\quad percentage\quad =\frac { 988 }{ 1235 } \times 100%=80%\)
19. (b)
Number of women working in IT department
\(= 3250 \times \frac { 57.6 ^ { \circ } } { 360 ^ { \circ } } \times \frac { 3 } { 10 } = 156\)
Total number of employees = 3250
\(Required\quad percentage\quad \frac { 156 }{ 3250 } \times 100%=4.8%\)
20. (b)
Number of men working in accounts department
\(= 3250 \times \frac { 50.4 ^ { \circ } } { 360 ^ { \circ } } \times \frac { 6 } { 13 } = 210\)
Number of men working in marketing department
\(= 3250 \times \frac { 79.2 ^ { \circ } } { 360 ^ { \circ } } \times \frac { 3 } { 5 } = 429\)
Number of men working in IT department
\(= 3250 \times \frac { 57.6 ^ { \circ } } { 360 ^ { \circ } } \times \frac { 7 } { 10 } = 364\)
Number of men working in HR department
\(= 3250 \times \frac { 36 ^ { \circ } } { 360 ^ { \circ } } \times \frac { 12 } { 25 } = 156\)
Number of men working in production department
\(= 3250 \times \frac { 136.8 ^ { \circ } } { 360 ^ { \circ } } \times \frac { 4 } { 5 } = 988\)
Hence, total number of men working in the organization
= 210 + 429 + 364 + 156 + 988 = 2147
Data Interpretation Question for IBPS PO 2012 Exam
Study the following graph and table carefully and answer the questions given below : (IBPS PO/MT 2012)
TIME TAKEN TO TRAVEL (IN HOURS) BY SIX
VEHICLES ON TWO DIFFERENT DAYS
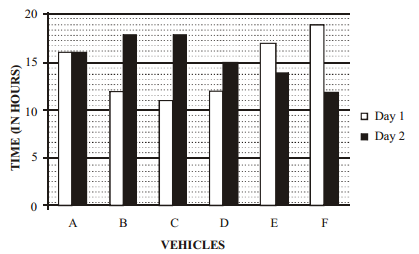
DISTANCE COVERED (IN KILOMETERS) BY SIX VEHICLES ON EACH DAY
| Vehicle | Day 1 | Day 2 |
| A | 832 | 864 |
| B | 516 | 774 |
| C | 693 | 810 |
| D | 552 | 765 |
| E | 935 | 546 |
| F | 703 | 636 |
1. Which of the following vehicles travelled at the same speed on both the days ?
(a) Vehicle A
(b) Vehicle C
(c) Vehicle F
(d) Vehicle B
(e) None of these
2. What was the difference between the speed of vehicle A on day 1 and the speed of vehicle C on the same day ?
(a) 7 km/hr.
(b) 12 km/hr.
(c) 11 km/hr.
(d) 8 km/hr.
(e) None of these
3. What was the speed of vehicle C on day 2 in terms of meters per second?
(a) 15.3
(b) 12.8
(c) 11.5
(d) 13.8
(e) None of these
4. The distance traveled by vehicle F on day 2 was approximately what percent of the distance traveled by it on day 1?
(a) 80
(b) 65
(c) 85
(d) 95
(e) 90
5. What is the respective ratio between the speeds of vehicle D and vehicle E on day 2 ?
(a) 15:13 1 1
(b) 17:13
(c) 13:11
(d) 17:14
(e) None of these
Study the following pie-chart and table carefully and answer the questions given below : (IBPS PO/MT 2012)
PERCENTAGE WISE DISTRIBUTION OF THE NUMBER OF MOBILE PHONES SOLD BY A SHOPKEEPER DURING SIX MONTHS Total number of mobile phones sold = 45,000
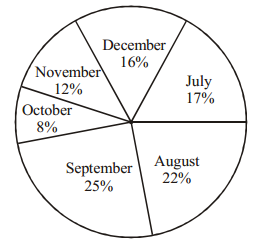
The respective ratio between the number of mobile phones sold of company A and company B during six months
| Month | Ratio |
| July | 8:7 |
| August | 4:5 |
| September | 3:2 |
| October | 7:5 |
| November | 7:8 |
| December | 7:9 |
6. What is the respective ratio between the number of mobile phones sold of company B during July and those sold during December of the same company ?
(a) 119:145
(b) 116:135
(c) 119 :135
(d) 119:130
(e) None of these
7. If 35% of the mobile phones sold by company A during November were sold at a discount, how many mobile phones of company A during that month were sold without a discount?
(a) 882
(b) 1635
(c) 1638
(d) 885
(e) None of these
8. If the shopkeeper earned a profit of ₹ 433/- on each mobile phone sold of company B during October, what was his total profit earned on the mobile phones of that company during the same month ?
(a) ₹ 6,49,900/-
(b) ₹ 6,45,900/-
(c) ₹ 6,49,400/-
(d) ₹ 6,49,500/-
(e) None of these
9. The number of mobile phones sold of company A during July is approximately what percent of the number of mobile phones sold of company A during December ?
(a) 110
(b) 140
(c) 150
(d) 105
(e) 130
10. What is the total number of mobile phones sold of company B during August and September together ?
(a) 10,000
(b) 15,000
(c) 10,500
(d) 9,500
(e) None of these
Study the following information and answer the questions that follow :
The premises of a bank are to be renovated. The renovation is in terms of flooring. Certain areas are to be floored either with marble or wood. All rooms/halls and pantry are rectangular. The area to be renovated comprises of a hall for customer transaction measuring 23 m by 29 m, branch manager’s room measuring 13 m by 17 m, a pantry measuring 14 m by 13 m, a record keeping cum server room measuring 21m by 13 m and locker area measuring 29 m by 21 m. The total area of the bank is 2000 square meters. The cost of wooden flooring is ‘ 170/- per square meter and the cost of marble flooring is ‘ 190/- per square meter. The locker area, record keeping cum server room and pantry are to be floored with marble. The branch manager’s room and the hall for customer transaction are to be floored with wood. No other area is to be renovated in terms of flooring. (IBPS PO/MT 2012)
11. What is the respective ratio of the total cost of wooden flooring to the total cost of marble flooring ?
(a) 1879 : 2527
(b) 1887 : 2386
(c) 1887 : 2527
(d) 1829 : 2527
(e) 1887 : 2351
12. If the four walls and ceiling of the branch managers room (The height of the room is 12 meters) are to be painted at the cost of ₹ 190/- per square meter, how much will be the total cost of renovation of the branch manager’s room including the cost of flooring ?
(a) ₹ 1,36,800/-
(b) ₹ 2,16,660/-
(c) ₹ 1,78.790/-
(d) ₹ 2,11,940/-
(e) None of these
13. If the remaining area of the bank is to be carpeted at the rate of ₹ 110/- per square meter, how much will be the increment in the total cost of renovation of bank premises ?
(a) ₹ 5,820/-
(b) ₹ 4,848/-
(c) ₹ 3,689/-
(d) ₹ 6,890/-
(e) None of these
14. What is the percentage area of the bank that is not to be renovated ?
(a) 2.2
(b) 2.4
(c) 4.2
(d) 4.4
(e) None of these
15. What is the total cost of renovation of the hall for customer transaction and the locker area ?
(a) ₹ 2,29,100/-
(b) ₹ 2,30,206/-
(c) ₹ 2,16,920/-
(d) ₹ 2,42,440/-
(e) None of these
Study the following information and answer the questions that follow : (IBPS PO/MT 2012)
THE GRAPH GIVEN BELOW REPRESENTS THE PRODUCTION (IN TONNES) AND SALES (IN TONNES)
OF COMPANY A FROM 2006-2011
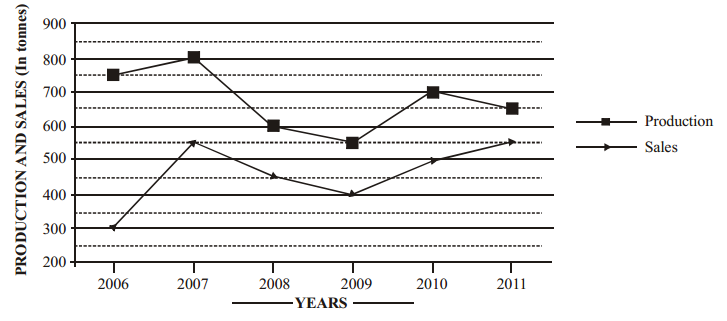
The table given below represents the respective ratio of the production (in tonnes) of Company A to the production (in tonnes) of Company B, and the respective ratio of the sales (in tonnes) of Company A to the sales (in tonnes) of Company B.
| Year | Production | Sales |
| 2006 | 5:4 | 2:3 |
| 2007 | 8:7 | 11:12 |
| 2008 | 3:4 | 9:14 |
| 2009 | 11:12 | 4:5 |
| 2010 | 14:13 | 10:9 |
| 2011 | 13:14 | 1:1 |
16. What is the approximate percentage increase in the production of Company A (in tonnes) from the year 2009 to the production of Company A (in tonnes) in the year 2010?
(a) 18
(b) 38
(c) 23
(d) 27
(e) 32
17. The sales of Company A in the year 2009 was approximately what percent of the production of Company A in the same year?
(a) 65
(b) 73
(c) 79
(d) 83
(e) 69
18. What is the average production of Company B (in tonnes) from the year 2006 to the year 2011?
(a) 574
(b) 649
(c) 675
(d) 593
(e) 618
19. What is the respective ratio of the total production (in tonnes) of Company A to the total sales (in tonnes) of Company A?
(a) 81 : 64
(b) 64 : 55
(c) 71 : 81
(d) 71 : 55
(e) 81 : 55
20. What is the respective ratio of production of Company B (in tonnes) in the year 2006 to production of Company B (in tonnes) in the year 2008?
(a) 2 : 5
(b) 4 : 5
(c) 3 : 4
(d) 3 : 5
(e) 1 : 4
Data Interpretation Question for IBPS PO 2012 Answers
| Day 1 | Day 2 | ||||||
| Time in hr | Distance in km | Speed in km/hr | Time in hr | Distance in km | Speed in km/hr | ||
| 16 | 832 | 52 | 16 | 864 | 54 | ||
| 12 | 516 | 43 | 18 | 774 | 43 | ||
| 11 | 693 | 63 | 18 | 810 | 45 | ||
| 12 | 552 | 46 | 15 | 765 | 51 | ||
| 16 | 935 | 58.4 | 14 | 546 | 39 | ||
| 19 | 703 | 37 | 12 | 636 | 53 | ||
1. (d)
Vehicle B.
2. (c)
Speed of vehicle A on day 1 = 52 km/hr
Speed of vehicle C on day 1 = 63 km/hr
Difference = 63 – 52 = 11 km / hr
3. (e)
Speed of vehicle can day 2 = 45 km/hr
\(\Rightarrow \left( 45 \times \frac { 5 } { 18 } \right) \mathrm { m } / \mathrm { sec } = 12.5 \mathrm { m } / \mathrm { sec }\)
4. (e)
Percentage
\(= \frac { \text { Distance travelled by vehicle } F \text { on day } 2 } { \text { Distance travelled by vehicle } F \text { on day } 1 } \times 100\)
\(= \frac { 636 } { 703 } \times 100 = \frac { 630 } { 700 } \times 100 \approx 90 \%\)
5. (b)
Speed of vehicle D on day 2 = 51
Speed of vehicle E on day 2 = 39
\(Required\quad ratio\quad =\frac { 51 }{ 39 } =\frac { 17 }{ 13 } { or }17:13\)
| Total number of Mobiles Sold | Total Number of Mobiles Sold of Company A | Total Number of Mobiles Sold of Company B | |
| July | 7650 | 4080 | 3570 |
| August | 9900 | 4400 | 5500 |
| September | 11250 | 6750 | 4500 |
| October | 3600 | 2100 | 1500 |
| November | 5400 | 2520 | 2880 |
| December | 7200 | 3150 | 4050 |
6. (c)
Number of mobiles sold of company B in July = 3570
Number of mobiles sold of company B in December = 4050
Required Ratio = 3570 : 4050 = 119 : 135
7. (c)
Total mobiles sold by company A during November = 2520
Total mobiles sold by this company at discount = 35% of 2520 = 882
Total mobiles sold by company A without discount = 2520 – 882 = 1638
8. (d)
Mobile phones sold of company B during October = 1500
Total profit earned on the mobile phones
= ₹ (433 x 1500) = ‘₹6,49,500
9. (e)
Number of mobile phones sold of company A during July = 4080
Number of mobile phones sold by company A during December = 3150
\(Required percentage \)
10. (a)
Mobile phones sold of company B during August = 5500
Mobile phones sold of company B during September = 4500
Total nmnber of mobile phones = 5500 + 4500 = 10,000
11. (c)
Area of customer transaction room = 23m × 29m = 667 sq.m
Area of branch manager room = 13m × 17 m= 221 sq. m
Area of Pantry room = 14m × 13m = 182 sq. m
Area of Server room = 21m × 13m = 273 sq. m
Area of locker room = 29 m × 21 m = 609 sq. m
Total cost of wooden flooring = ₹ [(170 × (667 + 221)] = ₹ (888 × 170)
Total cost of marble flooring = ₹ [(190 × (182 + 273 + 609)] = ₹ (190 x 1064)
Required Ratio = 888 × 170 : 1064 × 190 = 1887 : 2527
12. (c)
Area of 4 walls and ceiling of branch managers room
= 2 (lh + bh) + lb = 2 [17 × 12 + 13 × 12] + 13 × 17 = 941 sq. m
Total cost of renovatin = ₹ 190 × 941 = ₹ 178790
13. (e)
Total area of bank is 2000 sq. m
Total area of bank to be renovated = 1952 sq. m
Remaining Area = 2000 – 1952 = 48 sq. m
Total cost Remaining Area to be carpeted at the rate of ₹ 110/sq. meter = ₹ (48 x 110) = ₹ 5280
14. (b)
percentage area of bank not to be renovated
\(\Rightarrow \frac { \text { Area bank not be renovated } } { \text { Total area of bank } } \Rightarrow \frac { 48 } { 2000 } \times 100 = 2.4 \%\)
15. (a)
Total cost of hall of customer transaction = ₹ (170 × 667) = ₹ 113,390
Total cost of Locker area = ₹ (190 × 609) = ₹ 115710
Total cost of customer transaction hall + locker area = ₹ (113390 + 115710) = ₹ 229100
16. (d)
Percentage increase
\(= \frac { 2010 – 2009 } { 2009 } \times 100\)
\(= \frac { 700 – 550 } { 550 } \times 100 = 27.2 = 27 \%\)
17. (b)
Percent of production
\(= \frac { 400 } { 550 } \times 100 = 72.72 \approx 73 \%\)
18. (c)
| Year | Production of B |
| 2006 | 600 |
| 2007 | 700 |
| 2008 | 800 |
| 2009 | 600 |
| 2010 | 650 |
| 2011 | 700 |
19. (e)
Total production of company A = 4050
Total sales of company A = 2750
Required ratio ⇒ 4050 : 2750 = 81 : 55
20. (c)
Required ratio = production of B in the year 2006 :
Production of B in the year 2008
⇒ 600 : 800 ⇒ 3 : 4
Data Interpretation Question for IBPS PO 2011 Exam
Study the information given in eaeh of these questions and then answer the questions. (IBPS Associates PO 2011)
1. Population in Million
| City | Total Population | Male Population |
| A | 12 | 6.5 |
| B | 15 | 7.2 |
| C | 17 | 9.0 |
| D | 19 | 9.9 |
| E | 22 | 10.8 |
What is the average female population in million?
(a) 8.32
(b) 8.86
(c) 8.68
(d) 9.12
(e) None of these
2. What is the percent rise in production in 2007 from 2006? (Round off to two digits after decimal)
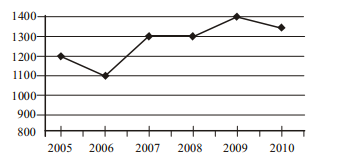
(a) 28.18%
(b) 18.18%
(c) 16.28%
(d) 26.18%
(e) None of these
Study the following pie-chart to answer the question that follows. (IBPS Associates PO 2011)
Break-up of students having a preference for each subject
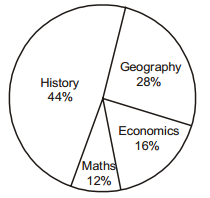
3. Out of a total 550 students, how many students did not prefer Maths or Economics?
(a) 462
(b) 154
(c) 196
(d) 396
(e) None of these
4.
| Person | Salary (in ₹ lakh) |
| A | 8.5 |
| B | 7.6 |
| C | 12.8 |
| D | 5.4 |
| E | 10.5 |
What is the difference (in ₹ lakh) between the average salary and the lowest salary?
(a) 4.2
(b) 2.65
(c) 3.56
(d) 4.06
(e) None of these
Study the table carefully to answer the questions that follow : (IBPS PO/MT 2011)
Number of people visiting six different Super-markets and the percentage of men, women, and children
| Names of the Super-markets | Total number of people | Percentage of | ||
| Men | Women | Children | ||
| A | 34560 | 35 | 55 | 10 |
| B | 65900 | 37 | 43 | 20 |
| C | 45640 | 35 | 45 | 20 |
| D | 55500 | 41 | 26 | 33 |
| E | 42350 | 6 | 70 | 24 |
| F | 59650 | 24 | 62 | 14 |
5. What is the respective ratio of number of women visiting Super-markets A to those visiting Super-market C?
(a) 35 : 37
(b) 245 : 316
(c) 352 : 377
(d) 1041 : 1156
(e) None of these
6. Number of men visiting Super-market D forms approximately what percent of the total number of people visiting all the Super-markets together?
(a) 11
(b) 5.5
(c) 13
(d) 9
(e) 7.5
7. Number of children visiting Super-market C forms what percent of the number of children visiting supermarket F? (rounded off to two digits after decimal)
(a) 91.49
(b) 49.85
(c) 121.71
(d) 109.30
(e) None of these
8. What is the total number of children visiting Super-markets B and D together?
(a) 18515
(b) 28479
(c) 31495
(d) 22308
(e) None of these
9. What is the average number of women visiting all the Super¬markets together?
(a) 24823.5
(b) 22388.5
(c) 26432.5
(d) 20988.5
(e) None of these
Study the following pie-chart and answer the questions given below: (IBPS PO/MT 2011)
Preferences of students among six beverages in terms of degree of angle in the pie-chart
Total no. of students = 6800
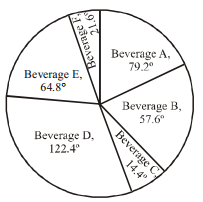
10. The number of students who prefer Beverage C are approximately what percent of the number of students who prefer Beverage D ?
(a) 7
(b) 12
(c) 18
(d) 22
(e) 29
11. How many students prefer Beverage B and Beverage E together ?
(a) 2312
(b) 2313
(c) 2315
(d) 2318
(e) None of these
12. What is the difference between the total number of students who prefer Beverage A and C together and the total number of students who prefer Beverage D and F together?
(a) 959
(b) 955
(c) 952
(d) 954
(e) None of these
13. The number of students who prefer Beverage E and F together are what percent of the total number of students?
(a) 18
(b) 14
(c) 26
(d) 24
(e) None of these
14. What is the respective ratio between the number of students who prefer Beverage F and the number of students who prefer Beverage A ?
(a) 3 : 11
(b) 3 : 13
(c) 6 : 11
(d) 5 : 11
(e) None of these
Study the table carefully to answer the questions that follow : (IBPS PO/MT 2011)
Percentage of Marks Obtained by Different Students in Different Subjects of MBA
| Students | SUBJECTS (Maximum Marks) | |||||
| Strategic Management
(150) |
Brand Management
(100) |
Compensation Management
(150) |
Consumer Behaviour
(125) |
Service Marketing
(75) |
Training & Development (50) |
|
| Anushka | 66 | 75 | 88 | 56 | 56 | 90 |
| Archit | 82 | 76 | 84 | 96 | 92 | 88 |
| Arpan | 76 | 66 | 78 | 88 | 72 | 70 |
| Garvita | 90 | 88 | 96 | 76 | 84 | 86 |
| Gunit | 64 | 70 | 68 | 72 | 68 | 74 |
| Pranita | 48 | 56 | 50 | 64 | 64 | 58 |
15. How many marks did Anushka get in all the subjects together?
(a) 369
(b) 463
(c) 558
(d) 496
(e) None of these
16. Who has scored the highest total marks in all the subjects together ?
(a) Archit
(b) Gunit
(c) Pranita
(d) Garvita
(e) Arpan
17. Marks obtained by Garvita in Brand Management are what percent of marks obtained by Archit in the same subject ? (rounded off to two digits after decimal)
(a) 86.36
(b) 101.71
(c) 115.79
(d) 133.33
(e) None of these
18. How many students have scored the highest marks in more than one subject ?
(a) Three
(b) Two
(c) One
(d) None
(e) None of these
19. What are the average marks obtained by all students together in Compensation Management ?
(a) 116
(b) 120
(c) 123
(d) 131
(e) None of these
Data Interpretation Question for IBPS PO 2011 Answers
1. (a)
The total population of all cities = 85 million
Total males in all cities = 43.4 million
Total females = 85 – 43.4 = 41.6 million
Average female population \(= \frac { 41.6 } { 5 } = 8.32\) million
2. (b)
\(\frac { ( 1300 – 1100 ) } { 1100 } \times 100 = 18.18 \%\)
3. (d)
\(\frac { 72 } { 100 } \times 550 = 396\)
4. (e)
Average salary
\(= \frac { 8.5 + 7.6 + 12.8 + 5.4 + 10.5 } { 5 }\)
\(= \frac { 44.8 } { 5 } = 8.96\)
Required answers = 8.96 –5.4 = 3.56 lakh
5. (e)
Required ratio
\(= 34560 \times \frac { 55 } { 100 } : 45640 \times \frac { 45 } { 100 }\)
= 19008 : 20538 = 1056 : 1141
6. (e)
Required percentage
\(= \frac { 55500 \times \frac { 41 } { 100 } } { 34560 + 65900 + 45900 + 45900 + 45640 + 55500 + 42350 + 59650 } \times 100\)
\(= \frac { 22755 } { 303600 } \times 100 = 7.495 \simeq 7.5 \% ( \text { Approx } )\)
7. (d)
Required percentage
\(= \frac { 45640 \times \frac { 20 } { 100 } } { 59650 \times \frac { 14 } { 100 } } \times 100 = \frac { 9128 } { 8351 } \times 100 = 109.30 \%\)
8. (c)
Required Number
\(= 65900 \times \frac { 20 } { 100 } + 55500 \times \frac { 33 } { 100 } = 13180 + 18315 = 31495\)
9. (a)
Required Average Number
\(= \frac { 34560 \times \frac { 55 } { 100 } + 65900 \times \frac { 43 } { 100 } + 45640 \times \frac { 45 } { 100 } + 55500 \times \frac { 26 } { 100 } + 42350 \times \frac { 70 } { 100 } + 59650 \times \frac { 62 } { 100 } } { 6 }\)
\(= \frac { 19008 + 28337 + 20538 + 14430 + 29645 + 36983 } { 6 }\)
\(= \frac { 148941 } { 6 } = 24823.5\)
10. (b)
Required percentage
\(= \frac { 14.4 ^ { \circ } } { 122.4 ^ { \circ } } \times 100 = 11.765 \simeq 12 \% ( \text { Approx } )\)
11. (a)
Required Number
\(= \left( \frac { 57.6 ^ { \circ } + 64.8 ^ { \circ } } { 360 ^ { \circ } } \right) \times 6800\)
\(= \frac { 122.4 ^ { \circ } } { 360 ^ { \circ } } \times 6800 = 2312\)
12. (c)
Required differaence
\(= \frac { \left( 79.2 ^ { \circ } + 14.4 ^ { \circ } \right) \sim \left( 122.4 ^ { \circ } + 21.6 ^ { \circ } \right) } { 360 ^ { \circ } } \times 6800\)
\(= \frac { 93.6 ^ { \circ } \sim 144.0 ^ { \circ } } { 360 ^ { \circ } } \times 6800 = 952\)
13. (d)
Required percentage
\(= \frac { 64.8 ^ { \circ } + 21.6 ^ { \circ } } { 360 ^ { \circ } } \times 100 = \frac { 86.4 ^ { \circ } } { 360 ^ { \circ } } \times 100 = 24 \%\)
14. (a)
Required Ratio = 21.6º : 79.2º = 3 :11
15. (b)
Marks scored by Anushka
\(=150\times \frac { 66 }{ 100 } +100\times \frac { 75 }{ 100 } +150\times \frac { 88 }{ 100 } +125\times \frac { 56 }{ 100 } +75\times \frac { 56 }{ 100 } +50\times \frac { 90 }{ 100 } \)
= 99 + 75 + 132 + 70 + 42 + 45 = 463
16. (d)
Marks scored by Archit
\(\begin{aligned} = 150 \times \frac { 82 } { 100 } + 100 \times \frac { 76 } { 100 } + 150 \times \frac { 84 } { 100 } + 125 \\ \times \frac { 96 } { 100 } + 75 \times \frac { 92 } { 100 } + 50 \times \frac { 88 } { 100 } \end{aligned}\)
= 123 + 76 + 126 + 120 + 69 + 44 = 558
Marks scored by Arpan
\(\begin{aligned} = 150 \times \frac { 76 } { 100 } + 100 \times \frac { 66 } { 100 } + 150 \times \frac { 78 } { 100 } + 125 \\ \times \frac { 88 } { 100 } + 75 \times \frac { 72 } { 100 } + 50 \times \frac { 70 } { 100 } \end{aligned}\)
= 114 + 66 + 117 + 110 + 54 + 35 = 496
Marks scored by Garvita
\(\begin{aligned} = 150 \times \frac { 90 } { 100 } + 100 \times \frac { 88 } { 100 } + 150 \times \frac { 96 } { 100 } + 125 \\ \times \frac { 76 } { 100 } + 75 \times \frac { 84 } { 100 } + 50 \times \frac { 86 } { 100 } \end{aligned}\)
= 135 + 88 + 144 + 95 + 63 + 43 = 568
Marks scored by Gunit.
\(\begin{aligned} = 150 \times \frac { 64 } { 100 } + 100 \times \frac { 70 } { 100 } + 150 \times \frac { 68 } { 100 } + 125 \\ \times \frac { 72 } { 100 } + 75 \times \frac { 68 } { 100 } + 90 \times \frac { 74 } { 100 } \end{aligned}\)
= 96 + 70 + 102 + 90 + 51 + 37 = 446
Marks scored by Pranita
\(\begin{aligned} = 150 \times \frac { 48 } { 100 } + 100 \times \frac { 56 } { 100 } + 150 \times \frac { 50 } { 100 } + 125 \\ \times \frac { 64 } { 100 } + 75 \times \frac { 64 } { 100 } + 50 \times \frac { 58 } { 100 } \end{aligned}\)
= 72 + 56 + 75 + 80 + 48 + 29 = 360
Hence, highest total marks scored by Garvita.
17. (c)
Required percentage
\(= \frac { 88 } { 76 } \times 100 = 115.79 \%\)
18. (b)
Two students i.e. Garvita strategic management brand management & compensation management and Archit consumer behaviour service marketing.
19. (a)
Required Average Marks
\(= \frac { ( 88 + 84 + 78 + 96 + 68 + 50 ) \times 150 } { 100 \times 6 } = \frac { 464 \times 150 } { 600 } = 116\)
Leave a Reply